just now

Liquidity Finder Ltd is incorporated in England and Wales, company number 10610740, registered address 167-169 Great Portland Street, Fifth Floor, London W1W 5PF, United Kingdom.
Published: just now

The Market Cycle Model- Main Market Trends
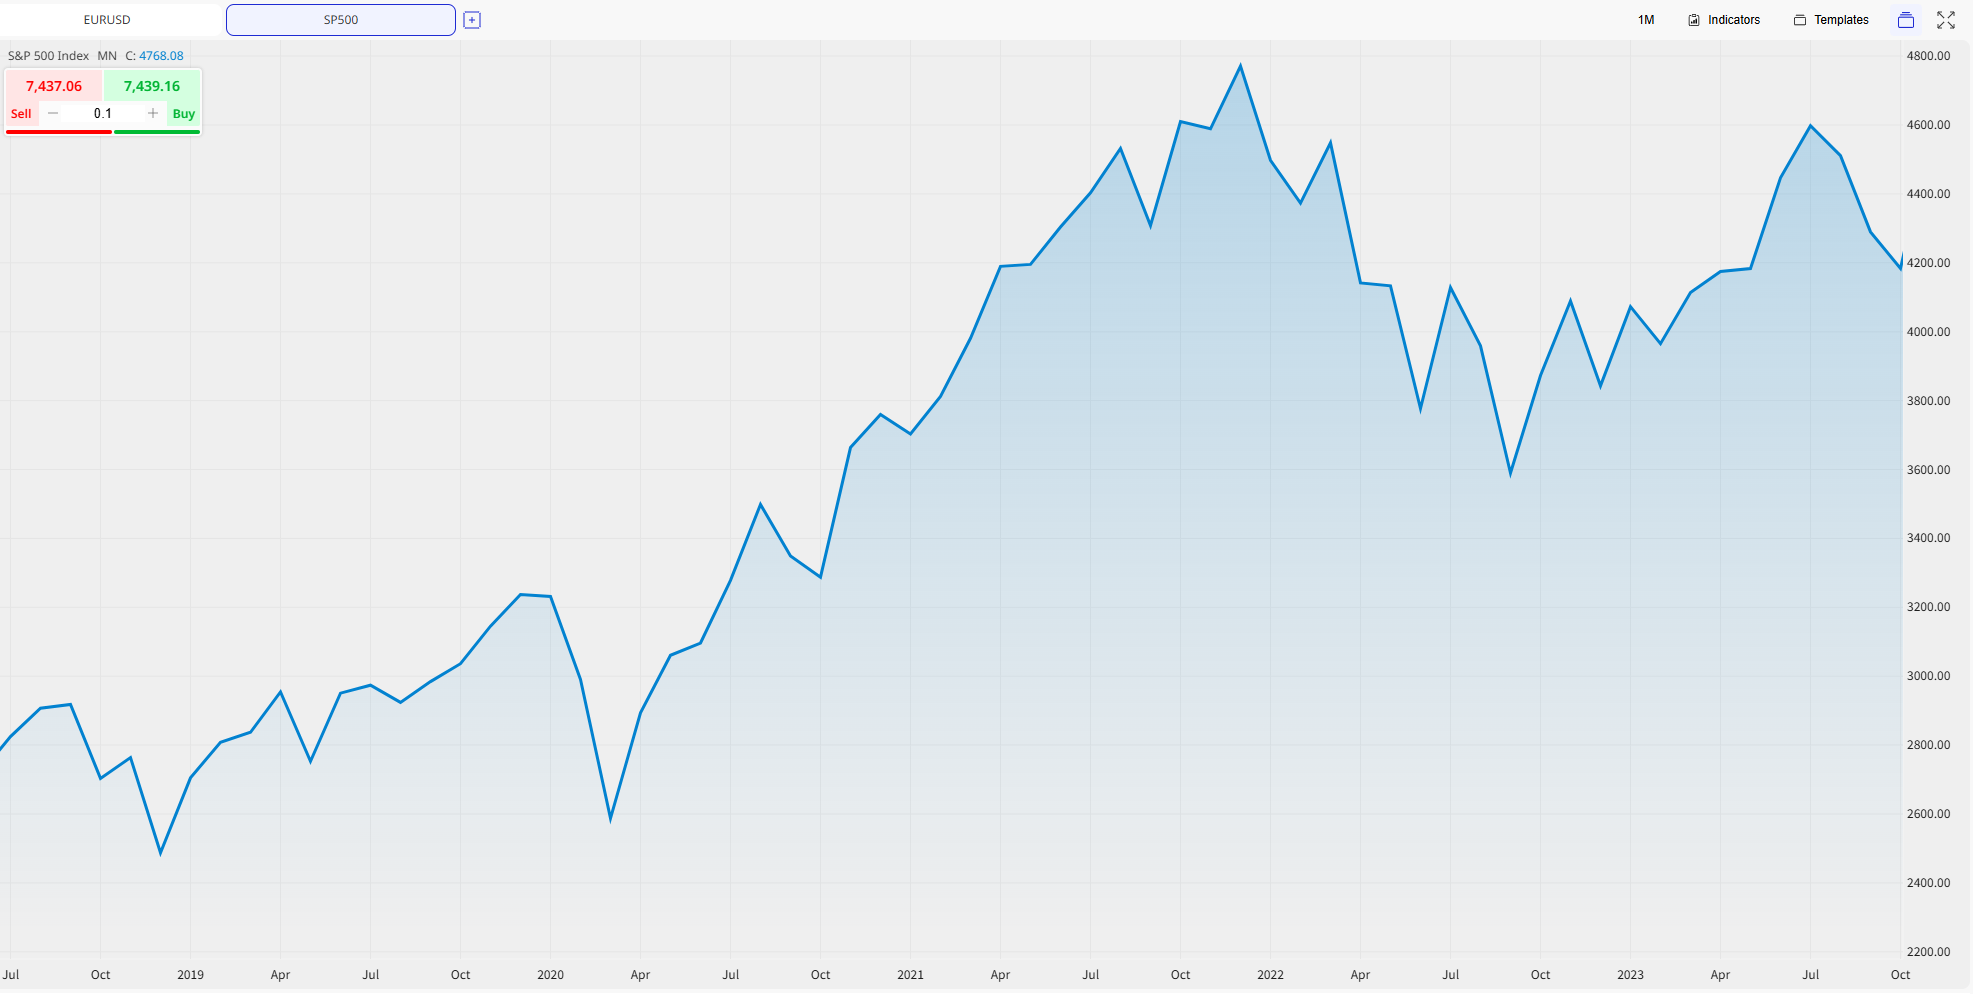
Primary Trends are dictated by the business cycle, lasting 9 months to 2 years.
Source: ACY
Primary Trend example of S&P500
Intermediate & Short-Term Trends are countercyclical movements lasting from few weeks to 9 months.
Secular Trends these are massive super cycles that span 10 to 25 years and dictate market magnitude.
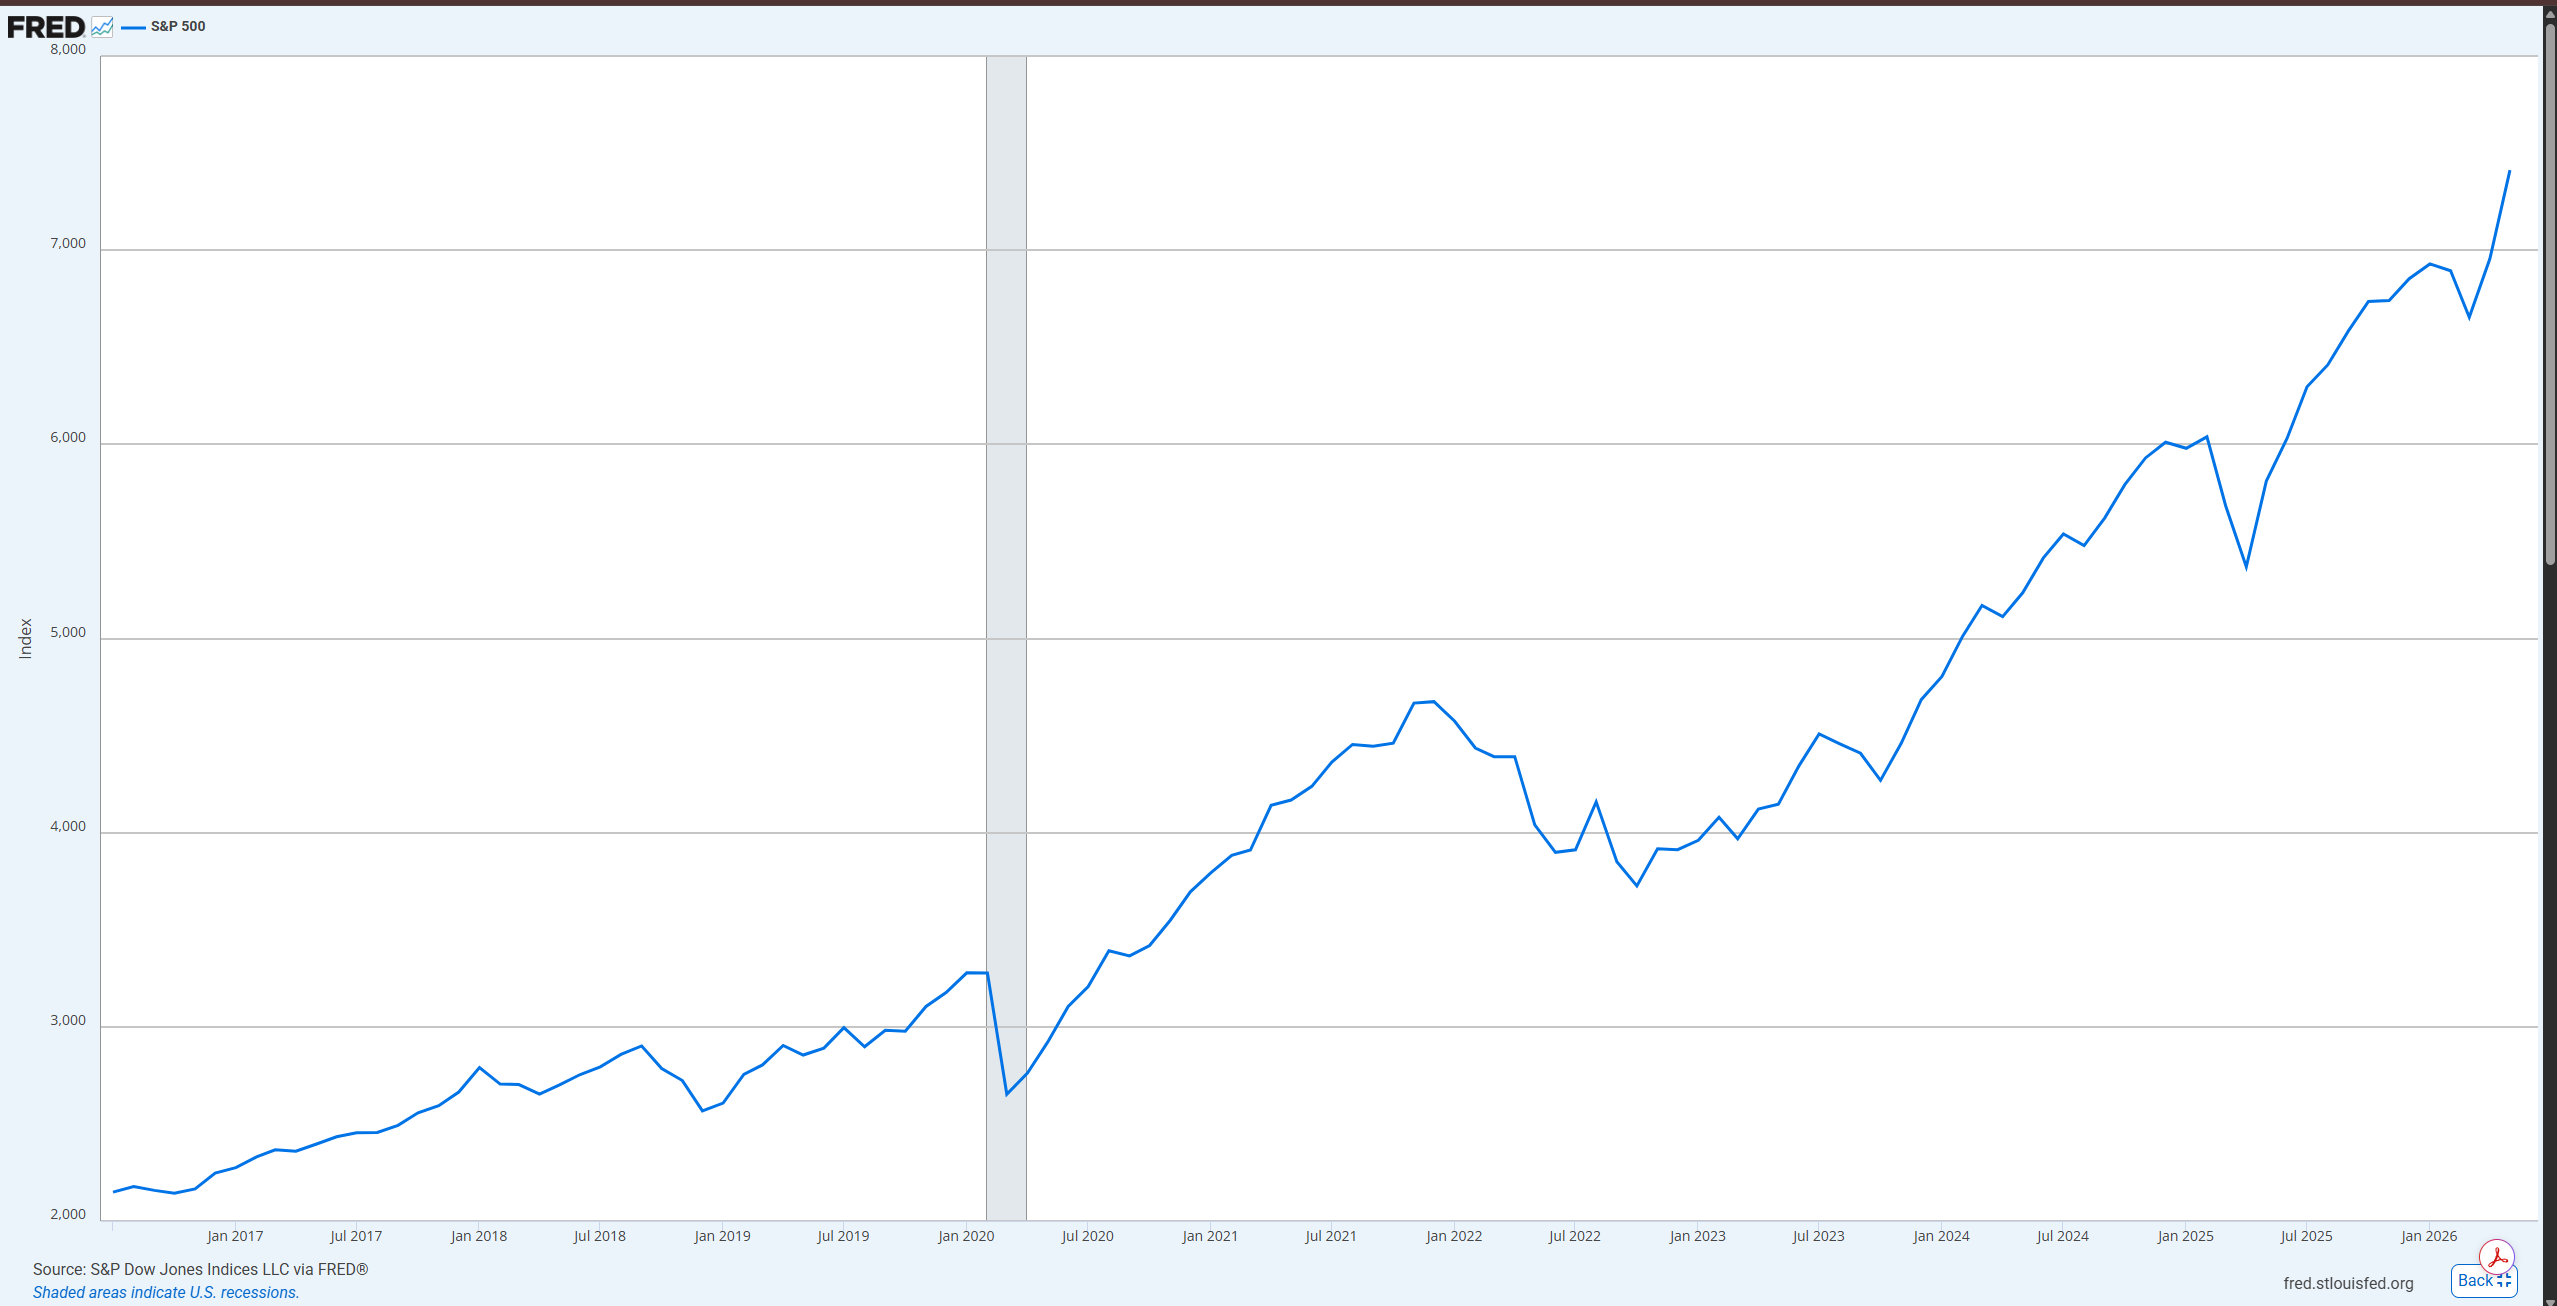
Source: FRED
Secular Trend example of S&P500
Aligning your trades with the primary trend prevents massive portfolio losses.
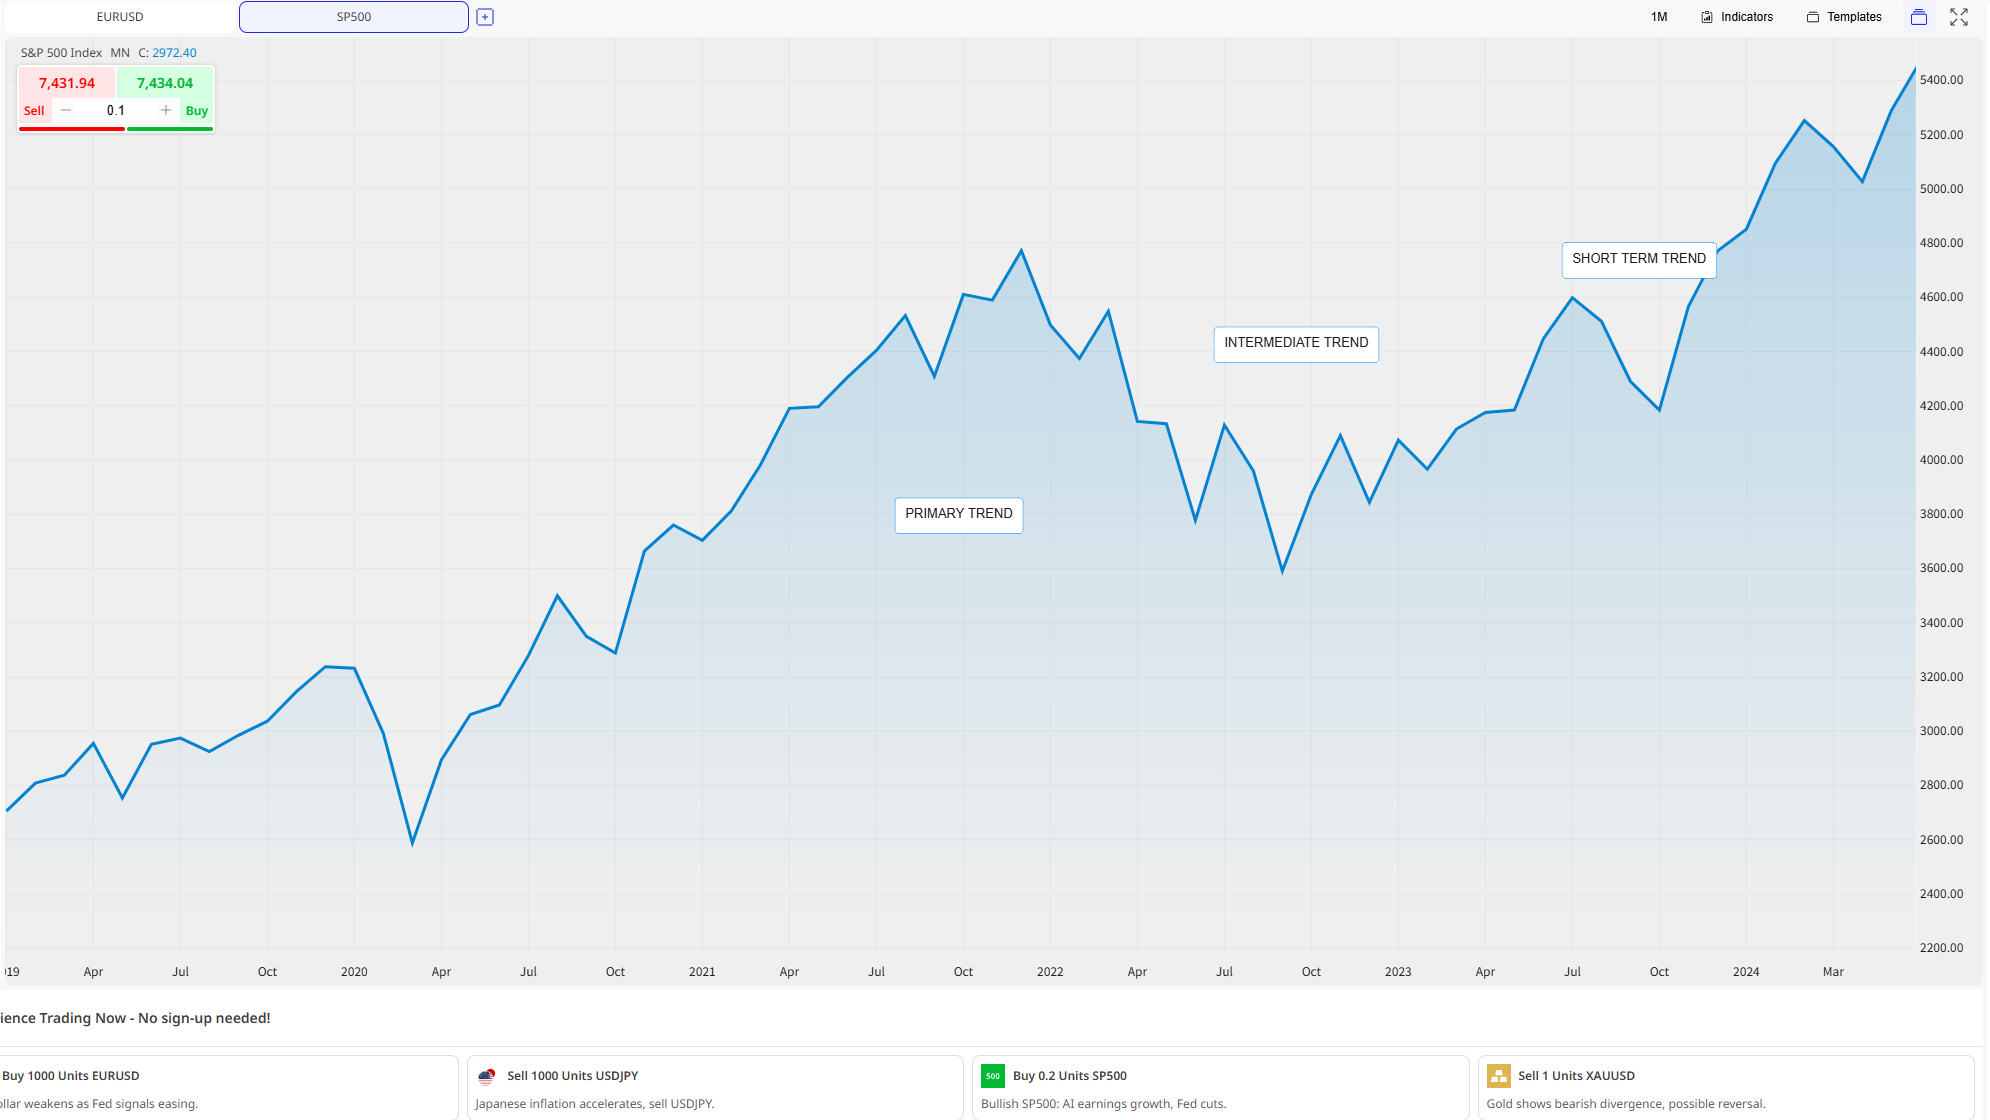
Source: ACY
Understanding the Market Cycle Model is the absolute key to true trading success. A trend simply measures the direction of price levels across different spans of time, which reveals exactly how investors feel about the underlying economy. It guides our choices.
There are several different trends happening at the exact same time in any given market. Identifying which one you are currently monitoring will prevent you from making costly mistakes with your capital. We must track them all.
The model breaks down these movements into five distinct categories based entirely on their duration. By learning these categories, both long-term investors and short-term traders can dramatically improve their win rates.
What is the primary trend cycle in the Market Cycle Model?
The primary trend is the main driver of the market, typically lasting anywhere between nine months and two full years. It perfectly reflects the attitude of investors toward the unfolding fundamentals of the broader business cycle. This cycle takes time.
A complete business cycle statistically lasts about 3.6 years from trough to trough. Because this economic timeline unfolds slowly, rising bull markets and falling bear markets naturally span one to two full years in total. Building up always takes longer than tearing down. Up moves take patience.
The primary trend cycle operates strongly within money markets, equities, and commodities alike. It also applies to currencies, but currency pairs do not fit as neatly into the business cycle approach because they compare two entirely different economies against each other. Both directions matter heavily.
In a perfect world, a primary bull market would be the exact same size as a primary bear market. Reality shows us that their magnitudes are actually quite different. You must always position your trades in the direction of this main trend.
How do intermediate and short-term trends work?
A primary upswing is never a straight line, as it is constantly interrupted by various reactions along the way. These countercyclical movements within a bull market are actually known as Intermediate Price Movements. They typically last anywhere from six weeks to nine months. They happen quite often.
Knowing the maturity of the primary trend is crucial, but tracking intermediate trends helps you secure much better success rates overall. It also gives you a massive advantage by helping you figure out exactly when the main primary movement might finally be running out of gas. Shifts happen fast.
Meanwhile, short-term trends interrupt the intermediate cycle of the Market Cycle Model in the exact same way. These quick movements usually last only two to four weeks. Random news events heavily influence these tiny swings, making them incredibly difficult to identify compared to longer phases. They are highly unpredictable.
What are intraday and secular trends?
Zooming in closely reveals intraday trends covering very short timespans. Technical analysis still applies here, but these tiny chart reversals carry absolutely zero long-term significance for your wider portfolio. They flip fast.
Extremely short-term price action is heavily driven by basic human psychology and instant, emotional reactions to breaking news. This makes the data highly erratic and far more vulnerable to manipulation as longer-term charts seem much more reliable. Stick to bigger timeframes.
We also have the massive secular trend. This super cycle is constructed from multiple primary trends that connect over a massive period of time. These sweeping historical movements usually last over 10 years, sometimes stretching to 25 years. They rule the market.
The secular trend greatly influences the raw magnitude of your primary rallies and reactions. For instance, primary bull markets will always be much larger than bear markets during a rising secular trend. Downward secular trends make bear markets way more powerful. Context is everything.
How does the Market Cycle Model lead investors and traders?
Long-term investors focus mostly on the primary trend found inside the Market Cycle Model. Even so, they absolutely must watch intermediate swings to protect their money. Understanding exactly how these faster, volatile movements impact the grand scheme is a vital analytical step for anyone. It prevents big losses.
If a long-term trend has just reversed upward, holding back your capital temporarily is often a very smart play. Jumping into a trade blindly based solely on a quick short-term swing can prove incredibly costly if you end up positioned against the main margin. Patience pays off greatly.
Short-term traders clearly prefer smaller price action, but they still need the larger primary picture. Upside surprises happen constantly in bull markets. Meanwhile, nasty downside shocks dominate bear phases and ruin poorly planned portfolios. A bad trading loss usually occurs simply because someone took a countercyclical stance against the true margin trend of the Market Cycle Model.
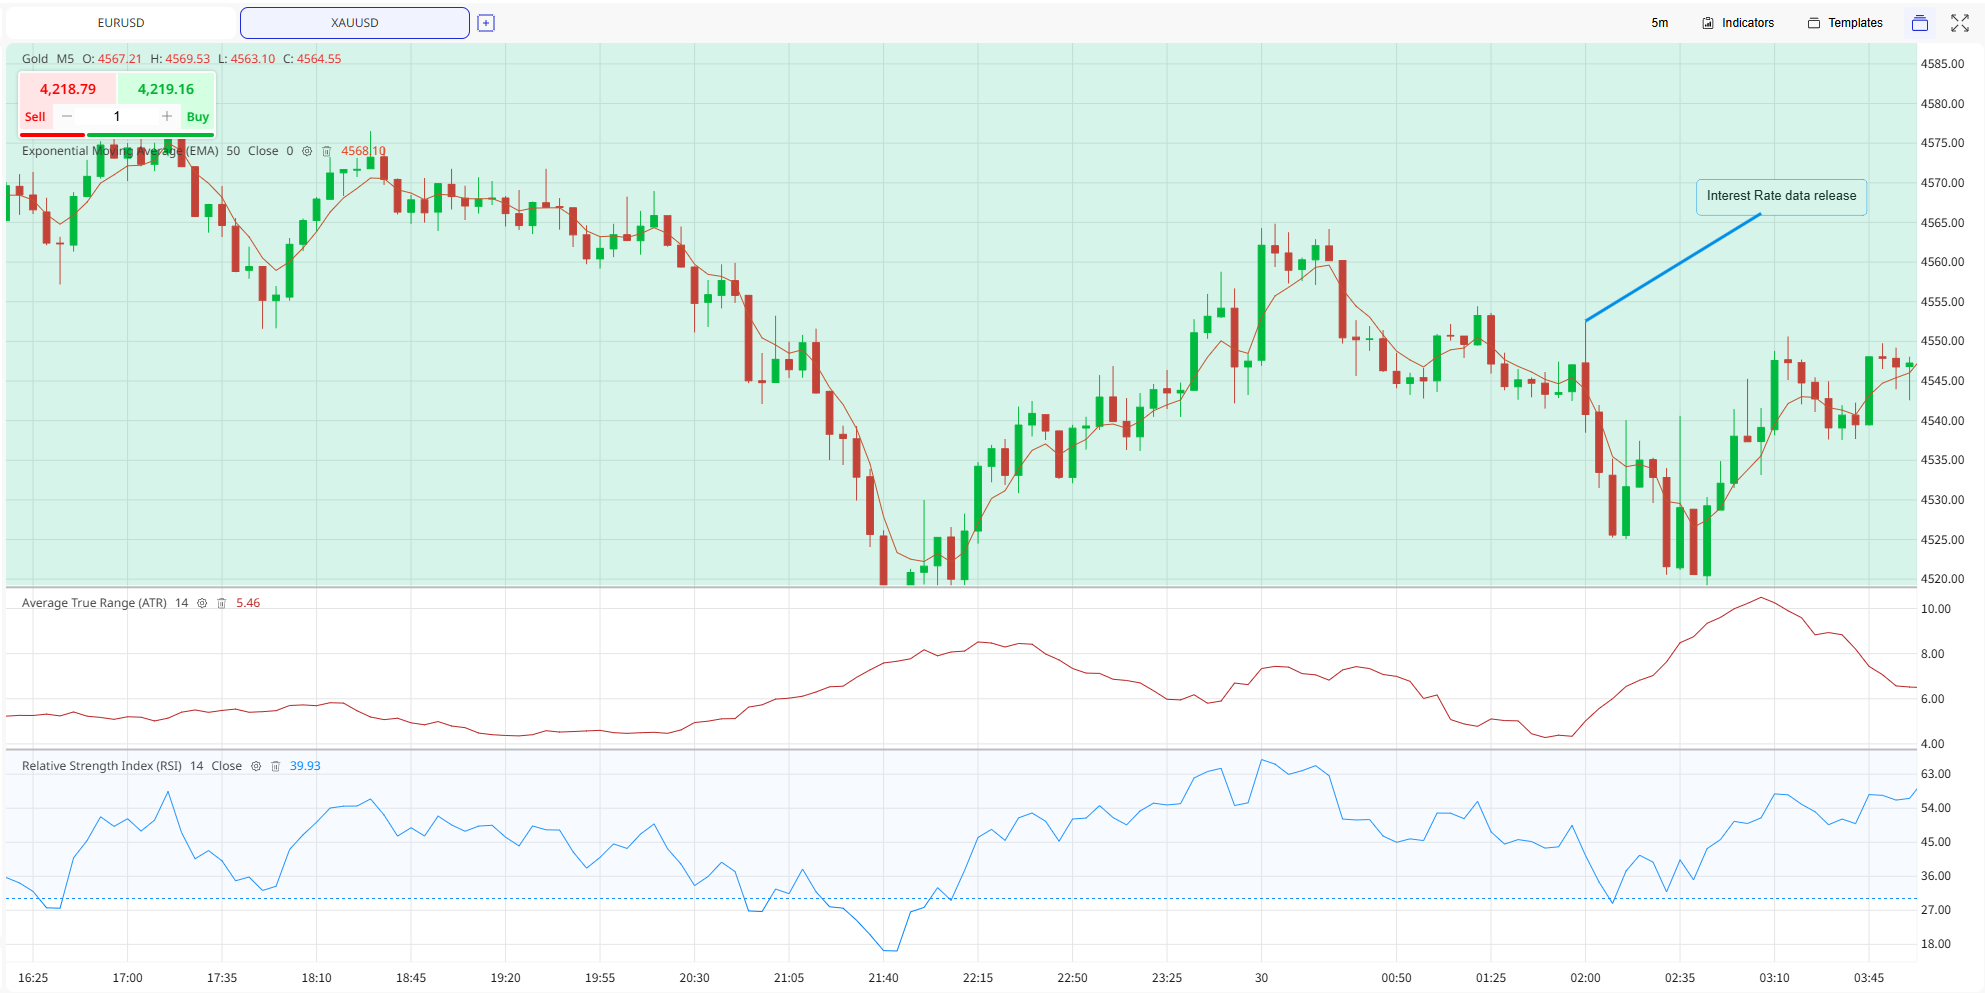
TRADING EXAMPLE WITH ECONOMIC INDICATOR INTEREST RATE WITH PAIR XAU/USD or GOLD over US DOLLAR.
The Conflict of Macro versus Micro
The Macro Bias is due to interest rates are decreasing (the Primary Trend), gold (a non-yielding asset) often benefits. Your Primary Trend bias might be bullish.
The Micro Shock is that when the FOMC release creating a momentary liquidity flush. Even if the long-term trend is bullish, the immediate reaction (the cluster of red candles in your M5 chart) can be bearish due to institutional liquidity hunting.
To align your technical execution with the macro-cycle:
First is to identify the Primary Trend that is check the interest rate environment. Are rates declining? Is Gold's secular or primary trend biased upward? Do not fight the margin trend is important to survive long-term volatility.
Next is anticipate the Intraday False Breakout that is during high-impact events like FOMC, expect the Liquidity Hunt. Most institutional players push prices against the trend to trigger stops.
Execute via buffers that is utilize the ATR to widen stops (avoid getting wicked out).
Use the EMA to filter the trend (don't flip your bias just because of one red candle).
Use the RSI or Fibonacci to identify where the erratic reaction has finished and the rational primary trend is ready to resume.
Your trading loss happens when you treat an Intraday event as a Primary trend reversal. By keeping your stop-loss wider than the current volatility (ATR) and keeping your eyes on the EMA of the higher timeframe, you stop reacting to the noise and start trading the cycle.
When trading the pair XAU/USD during the FOMC (Federal Open Market Committee) involves a change from standard trend-following to a focus on liquidity, volatility, and order flow. Since the FOMC releases generate massive, rapid fluctuations, traditional lagging indicators mostly cause sudden fail or provide false signals in the immediate aftermath.
For lower timeframe like 1 minute to 15 minute charting during high-impact news, you may prioritize tools that capture the real noise and institutional intent rather than simple trend lines.
With Average True Range (ATR) indicator is necessary for setting SL or stop-losses. Because during the FOMC, standard stops are mostly hit by initial whipsaw movements. You may use a 14-period ATR to gauge its current market volatility and widen your stops to at least 1.5x–2x the current ATR to survive its initial spike.
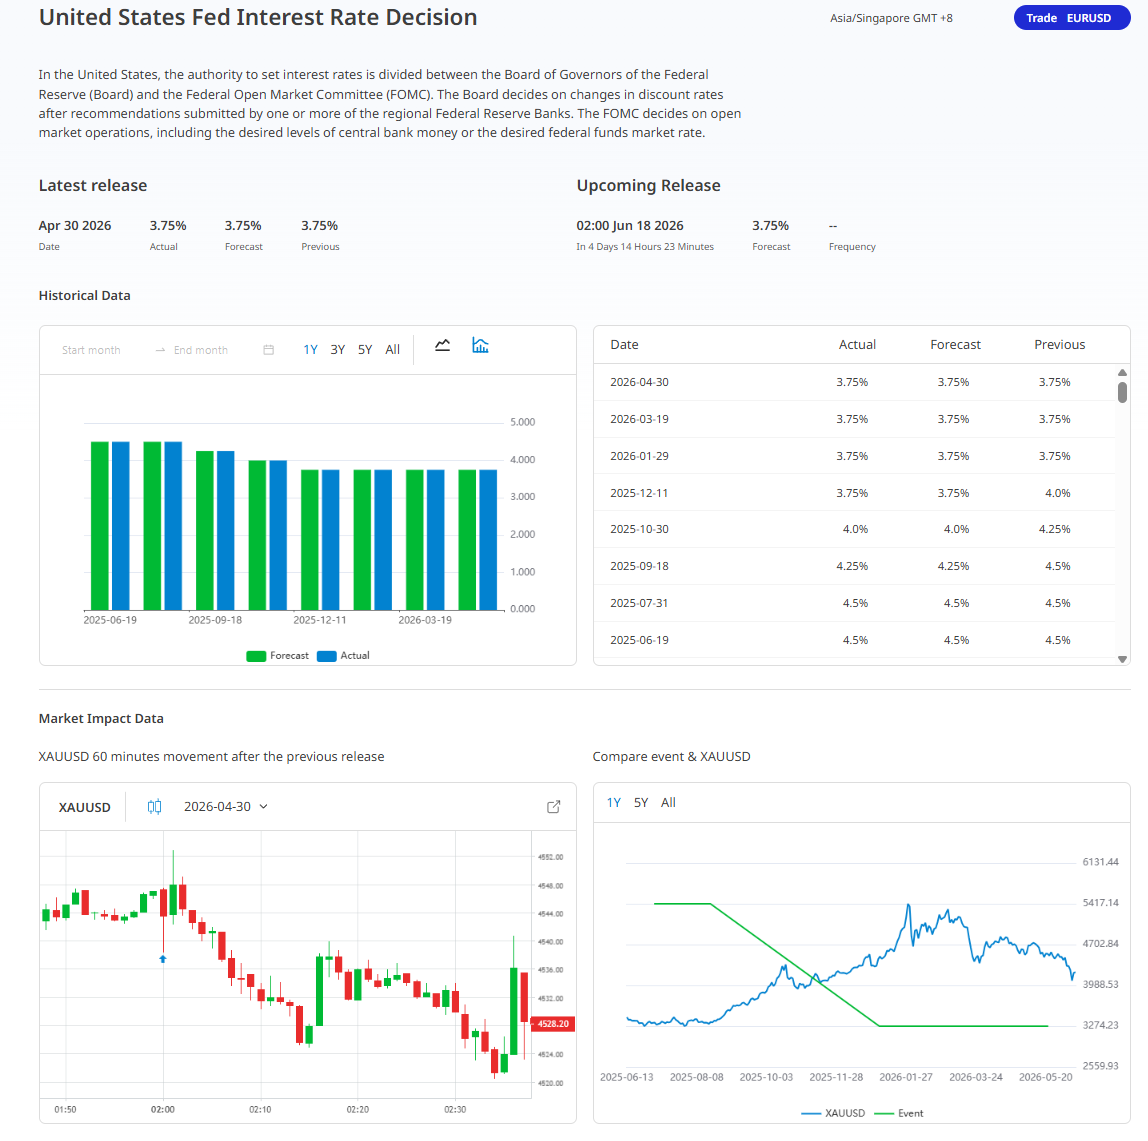
Source: Finlogix
Illustration above shows at how the U.S. Federal Reserve Interest Rate decisions impact the financial markets using Gold (XAUUSD) as an example.
Economic Indicator as The Interest Rate Trend
The top section shows the United States Fed Interest Rate Decision. If you look at the bar chart and the historical data series, you can see a clear trend which the interest rate has been gradually decreasing over the past year, dropping from 4.5% in mid-2025 down to the current level of 3.75% as of April 2026.
Influence on Gold
The lower part shows how these decisions affect the price of Gold (XAUUSD).
The left chart it shows its 60-minute movement snapshot as it tracks how the price of gold fluctuates specifically around the time of an interest rate release.
The right chart known as the Compare Event (the event is the data release) and the pair XAUUSD gives us a broader view showing how gold prices have moved in relation to interest rate events over the past year.
Source: ACY
The top displays candlestick bars for Gold with a reddish colored line that is overlaying the bars which is the 50-period Exponential Moving Average or EMA. This helps filter out market noise to show the general trend. Notice how the price interacts with this line it acts as a dynamic guide for the current market direction.
The blue arrow marks the Interest Rate data release. Immediately following this, there is a cluster of red candles, indicating a swift downward or bearish movement. This shows the immediate shock or volatility that happens when new data is released to the market.
Below the price chart are two key tools that help us read the story of the chart.
Average True Range or ATR is the red line at the bottom measuring volatility. You can see it spike right after the news release, confirming that the market became much more active and erratic during that period.
Relative Strength Index or RSI is the blue line measuring its momentum. It helps show whether the move is losing steam or has room to continue. When the RSI dips or drops toward the bottom of its range, it often signals that the asset is becoming oversold, probability setting the stage for a reversal or a period of stabilization, as seen in the latter half of the chart.
This setup is a classic way to monitor how a market digests information. The EMA gives us the trend, the ATR shows us the intensity of the reaction, and the RSI tells us if the move is stretched too far.
Execution
When the interest rate release occurs marked by the volatility spike in the illustration use your structural tools like Fibonacci retracements to identify potential levels of exhaustion for the initial reaction.
Wait for the price to reach these structural zones and monitor the Relative Strength Index (RSI) for signs of divergence or extreme conditions that confirm the sustainability of the post-news move.
Provided the quick 60-minute movement observed in the market impact data from the illustration set your stop-loss orders outside of the standard noise levels defined by the current ATR to prevent being wicked out of the position during the initial liquidity flush.
For Risk Management
With the pre-event positioning as provided that the Actual is exact as the Forecast scenario from the illustration shows a high probability of 60% of a decline in XAUUSD within 60 minutes your execution should favor waiting for the initial volatility to settle before engaging, unless you are scaling into a pre-existing bias.
As mentioned you may also use the Exponential Moving Averages (EMA) to filter out false breakouts immediately following the news, jus to secure that the trend following the volatility shock really align with your higher-timeframe outlook.
Why False Breakouts Happens?
First is due to Liquidity Hunting when larger market participants may push prices briefly past technical levels to trigger stop-loss orders from retail traders, providing the necessary liquidity to fill their own large buy or sell orders at better prices.
Another is there is insufficient momentum when a price might cross a technical level without enough buying or selling volume to sustain the breakout, leading to an immediate exhaustion of the move.
Last is due to news reactions because during high-impact events, such as the interest rate releases seen from the illustrations, the market may experience sudden, erratic spikes that break technical levels before immediately reverting to the prior trend.
Awareness of its volatility is a key to manage these breakouts by monitoring ATR as seen from the illustration so you can point out when the volatility is elevated which leads to high probability of erratic false breakouts.
Disclaimer: This content may have been written by a third party. ACY makes no representation or warranty and assumes no liability as to the accuracy or completeness of the information provided, nor any loss arising from any investment based on a recommendation, forecast or other information supplies by any third-party. This content is information only, and does not constitute financial, investment or other advice on which you can rely.
ACY Securities is one of Australia's fastest growing multi-asset online trading providers, offering ultra-low-cost trading, rock-solid execution, technologically superior account management and premium market analysis.
Select the categories and companies you wish to follow directly to your person rss feed.
Create Custom RSS FeedSign up and join over 5,000 professional members who receive personalized news alerts, curated professional connections, and more for free!
Retail futures trading leader NinjaTrader Group has appointed Mark Omens as Senior Vice President, Commercial Strategy, bringing a 25-year veteran of derivatives marketplace CME Group into a newly created role focused on exchange partnerships and enterprise growth.
Gold Price Action Forecast: Will XAU/USD Drop to $3930? Meta Description: Read our Gold price action forecast to see if XAU/USD will drop to $3930.
BitDelta Securities Financial Services LLC (“BitDelta Securities”) today announced that it has received full regulatory approval from the Capital Market Authority (“CMA”) of the United Arab Emirates under the Category 5 — Arrangement and Advice license framework (License No. 20200000439). The approval follows the firm's receipt of In-Principal Approval earlier this year and represents the successful conclusion of the CMA's full licensing process, including the satisfaction of capital requirements, governance appointments, and operational setup.
Crypto.com has received a $400 million strategic investment from Citadel Securities, valuing the firm at $20 billion. It marks the first institutional funding round in the company's history, aimed at accelerating its expansion into tokenised securities, derivatives and other asset classes.
WTI’s pullback into $79–82 is the first major test of the bullish Elliott Wave count, with buyers targeting a renewed break above $85.

BitDelta Securities has secured a full CMA Category 5 licence in the UAE and opened a regulated office in Business Bay, Dubai. The firm operates as an introducing broker, connecting investors with licensed international brokers across multiple asset classes, with CEO Dr. Demetrios Zamboglou commenting on the milestone.
Index volatility is asleep while single stocks fight it out underneath, credit refuses to confirm the equity rally, and a bare macro calendar hands next week to oil.
Digital assets and FX brokerage GC Exchange FZE (GCEX) has appointed Mohammed A. Mulla as a Board Member of its Dubai-based entity, part of the wider GCEX Group.
Learn what Blockchain-as-a-Service is, how it works, and why businesses are using BaaS to build blockchain applications without managing infrastructure.
CFDs vs stocks compared on leverage, ownership, costs, dividends, taxes, and risk. Learn the differences between stocks and CFDs and discover which suits your investing or trading goals.