
just now


Liquidity Finder Ltd is incorporated in England and Wales, company number 10610740, registered address 167-169 Great Portland Street, Fifth Floor, London W1W 5PF, United Kingdom.
Published: just now


The Bitcoin (BTCUSD) price forecast remains cautiously bullish as price holds the $78,400–$82,175 support zone. Repeated rejections on the weekly and daily charts suggest buyers are stepping in when Bitcoin falls toward this area.
Our previous forecast, “BTCUSD Price Action Forecast: Bitcoin Support Rejection Eyes $86,550” identified this same zone as a key area for buyers to defend. Bitcoin continues to hold that support, keeping the potential upside target of $86,550 in focus.
The next step is to see whether buyers can push price higher. A daily close above a recent price peak would strengthen the bullish outlook, while a break below support would weaken it.
The weekly Bitcoin chart continues to show rejection around $78,400–$82,175, suggesting buyers remain active at the support zone identified in the previous forecast.

Weekly Timeframe Price Action Analysis: Another Rejection as Buyers Defend the $78,400–$82,175 Support Zone
The latest reaction adds to the earlier support defense. Attempts to push price lower have continued to meet buying interest, helping preserve the developing bullish structure.
Understanding market structure and the direction of a market trend helps distinguish a potential higher low at support from confirmed bullish continuation.
Key weekly observations include:
The weekly reaction supports the bullish outlook, but the strength of the next advance matters. A sustained move away from support would provide stronger evidence of buyer control than repeated rejection alone.
Any rejection on a developing weekly candle should also be assessed against its eventual close.
The previous Bitcoin analysis identified an inverse head and shoulders pattern alongside a break above the 50 EMA.
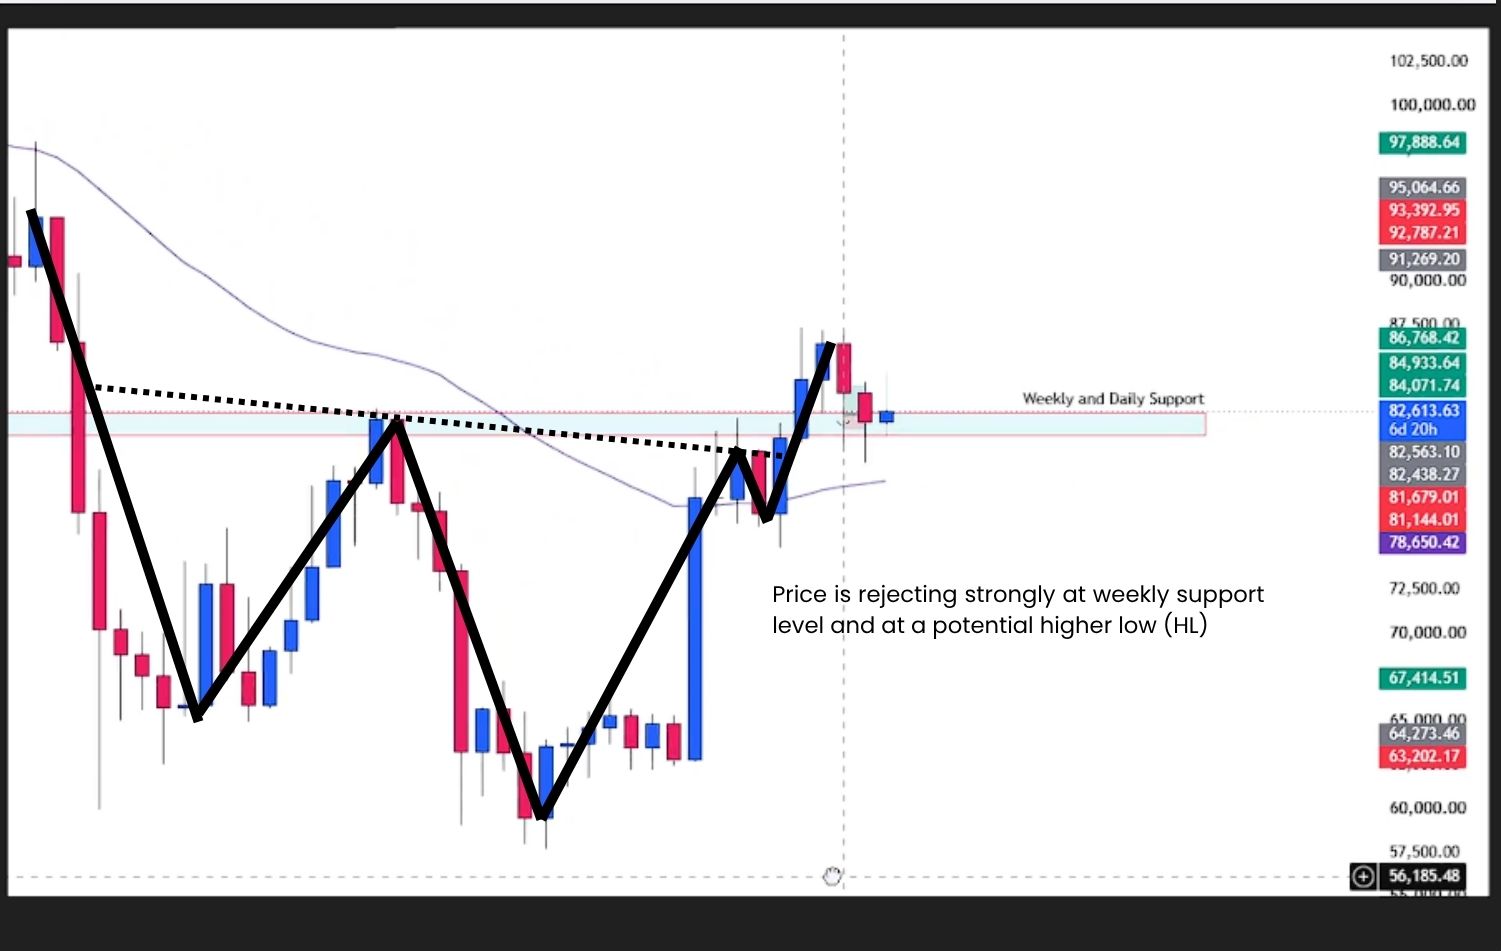
Weekly Chart Price Action Analysis. Previously Identified Inverse Head and Shoulders Formation
The pattern provides context for a potential shift from bearish to bullish structure. Following a neckline breakout, a successful retest can strengthen the reversal scenario if buyers defend the level from above.
The confirmation sequence to monitor is:
Combining this candlestick confirmation with improving market structure would strengthen the bullish case.
However, the latest rejection at weekly and daily support does not independently establish that the neckline and 50 EMA are also holding. Their current positions should be checked separately on the chart.
Pattern confirmation sequence: Neckline breakout → retest from above → bullish candle close → upward follow-through.
The daily Bitcoin chart also shows another series of rejections around the $78,400–$82,175 support zone, reinforcing the buying interest visible on the weekly timeframe.

Daily Timeframe Price Action Analysis: Repeated Rejections Suggest Buyers Are Holding the Support Zone
The previous analysis identified a break above former weekly and daily resistance. Buyers responding during subsequent pullbacks supports the interpretation that the reclaimed area is acting as support.
The latest reactions strengthen that interpretation. Price continues to meet demand around the zone rather than establishing a sustained breakdown beneath it.
Traders can study break and retest price action patterns to understand how former resistance can become support after a breakout.
The next requirement is stronger upward follow-through. A daily close above a nearby swing high would show that buyers are beginning to overcome short-term resistance.
A subsequent higher low would add further evidence that the rebound is developing into bullish continuation.
Identifying support and resistance levels helps define where Bitcoin’s next bullish or bearish scenario could develop.
| Technical LevelSignificance |
| $78,400–$82,175Weekly and daily support zone where buyers continue to show rejection |
| $82,175Upper boundary of the support zone |
| $80,268.75Internal support reference; a daily close below it would weaken the immediate rebound |
| $78,400Lower boundary; a confirmed breakdown would threaten the entire support zone |
| $86,550Near-term upside target if bullish continuation develops |
| $126,235.78Longer-term objective conditional on sustained bullish structure |
| $75,620Potential downside target if support fails |
| 50 EMATrend reference identified in the previous analysis; current positioning requires reassessment |
| Inverse head and shoulders necklineAdditional reversal confirmation reference |
| Nearby daily swing highStructural level to monitor for bullish continuation confirmation |
A move below $80,268.75 would indicate weakness inside support. A decisive break below $78,400 would provide stronger evidence that the broader zone has failed.

Daily Timeframe Price Action Analysis: Bullish Continuation Scenario Following Repeated Support Rejections
The bullish scenario remains supported by repeated rejection at weekly and daily support.
If buyers continue to defend $78,400–$82,175, the next development to monitor is a sustained advance above a nearby daily swing high.
A completed bullish rejection candle or bullish engulfing pattern can provide additional evidence of buying interest. Its significance increases when price follows through rather than immediately returning to support.

Daily Timeframe Price Action Analysis: Conditional Bullish Objective if Bitcoin Maintains Higher Highs and Higher Lows
The bullish confirmation sequence is:
Traders can strengthen their analysis by learning how to identify and trade high-probability price action setups at key levels. Combining market structure, support and resistance, and completed candlestick signals provides a clearer basis for assessing the rebound.
A daily close below $80,268.75 would weaken this immediate setup, particularly if buyers fail to reclaim the level.
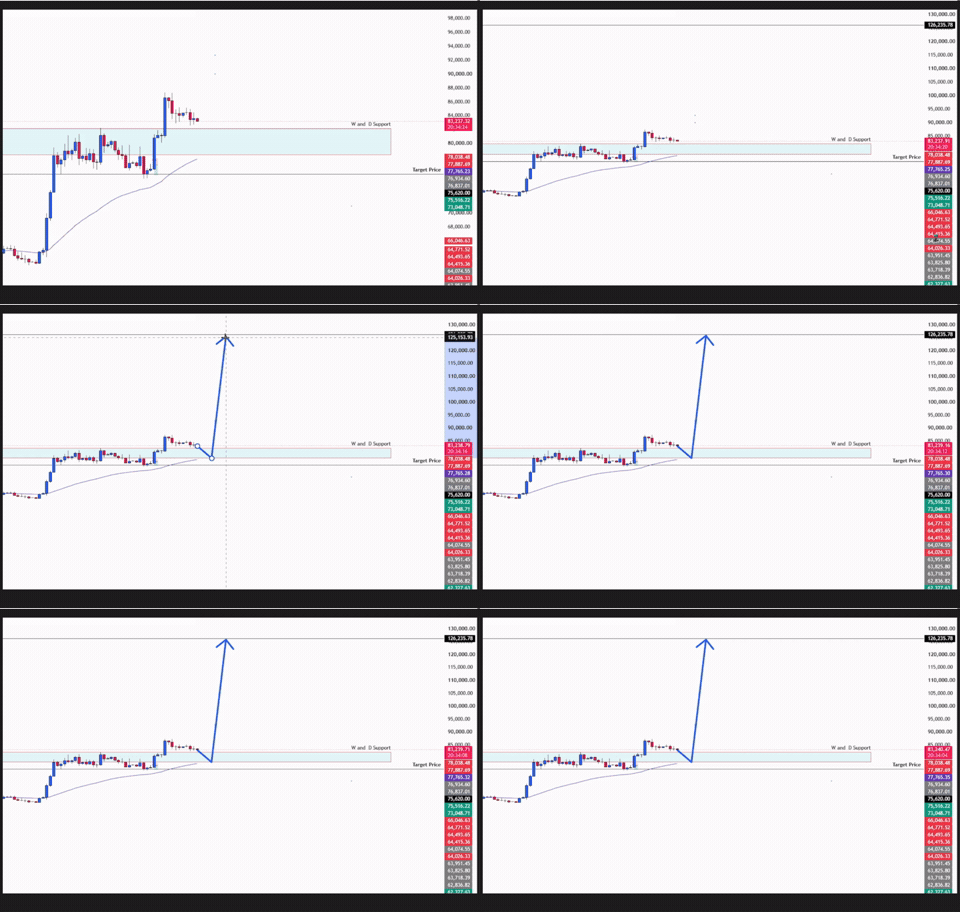
Longer-Term Price Action Analysis: Conditional Bullish Objective if Bitcoin Maintains Higher Highs and Higher Lows
The $126,235.78 objective remains part of the longer-term forecast.
For this scenario to strengthen, Bitcoin would need to progress beyond the current support reaction, move toward $86,550, and continue clearing intervening resistance.
Further breakouts, successful retests and sustained higher highs and higher lows would support the broader bullish interpretation.
The repeated weekly and daily rejections preserve the possibility of that progression. They do not confirm the longer-term target by themselves.

Daily Timeframe Price Action Analysis: Bearish Scenario if Buyers Fail to Maintain Support
Despite the repeated rejections, Bitcoin’s bullish outlook remains conditional on buyers maintaining the support zone.
A daily close below $80,268.75, followed by a failed recovery, would suggest that the immediate rebound is losing strength.
Because this level sits inside the broader support zone, buyers could still respond near $78,400. A decisive breakdown below that lower boundary would provide stronger evidence of a broader support failure.

Daily Timeframe Price Action Analysis: Conditional Bearish Objective if Bitcoin Maintains Higher Highs and Higher Lows
For a stronger bearish case, traders should monitor:
Understanding false breakouts and how to avoid breakout traps can help distinguish a sustained breakdown from a temporary move below support.
A brief decline beneath a level followed by a strong recovery would weaken the bearish interpretation.
Bitcoin’s latest weekly and daily price action continues to support a cautiously bullish outlook.
Another series of rejections at $78,400–$82,175 suggests buyers remain willing to defend the anticipated support area. This adds to the initial rebound and strengthens the support-holding scenario outlined in the previous forecast.
If buyers maintain support and push price above a nearby daily swing high, Bitcoin could extend toward $86,550.
Alternatively, a daily close below $80,268.75 would weaken the rebound. A confirmed breakdown below $78,400 would threaten the broader bullish setup and bring $75,620 into focus.
For buyers, the focus is on support holding, completed bullish confirmation and upward follow-through.
For sellers, the focus is on weakening support, failed recovery attempts and a sustained breakdown.
Watch the support. Wait for follow-through. Let price confirm the direction.
_____________________________________________________________________________________
Move from learning price action to applying it in the real market.
Trade:
Access trading platforms and tools including ACY, MT4, MT5, and Copy Trading.
Create an Account and Start Live Trading
_____________________________________________________________________________________
Build your trading foundation with these step-by-step guides:
Learn to read price action and assess trading setups at key levels:
Learn to recognize bullish, bearish and sideways markets:
Learn to mark key levels and interpret price reactions:
Understand recurring price patterns, retests and false breakouts:
Learn to combine candlestick signals with price action analysis:
Learn to recognize patterns that may signal a change in market direction:
Explore how to combine the exponential moving average with price action:
Bring your technical analysis skills together through a gold swing trading guide:
Learn how risk management and position sizing fit into your trading plan:
Learn how to plan take-profit targets using market structure and risk-reward:
Develop discipline, emotional awareness and a more consistent trading process:
Explore the psychological habits behind a disciplined trading approach:
_____________________________________________________________________________________
Not sure where to begin? Here’s a simple roadmap to guide you:
By building step by step; from basics → real trading → mastering the craft, you’ll gain clarity, confidence, and steady progress without ever feeling overwhelmed.

_____________________________________________________________________________________
Follow Ruffy Grant B. Capacio for Gold analysis, Forex trading ideas, price action education, trading psychology, and market insights: LinkedIn
ACY Securities: Join the Discord Server
Disclaimer:
Trading Forex, Gold, CFDs, cryptocurrencies, commodities, indices, and other leveraged financial instruments involves a high degree of risk and may not be suitable for all investors or traders. Market conditions can change rapidly, and leveraged trading can result in losses that occur quickly.
Before trading, carefully consider your investment objectives, level of experience, and risk tolerance. Only trade with capital you can afford to lose and seek independent financial or professional advice where appropriate.
All market analysis, price forecasts, technical commentary, trading scenarios, educational materials, and opinions presented in this content are provided solely for general informational and educational purposes. They do not constitute financial advice, investment advice, a recommendation, solicitation, or an offer to buy or sell any financial instrument.
Past performance and historical price movements are not reliable indicators of future results. Any price levels, targets, scenarios, or market outlooks discussed should be viewed as analysis rather than guarantees of future market performance. October 19, 2026
ACY Securities is one of Australia's fastest growing multi-asset online trading providers, offering ultra-low-cost trading, rock-solid execution, technologically superior account management and premium market analysis.

Select the categories and companies you wish to follow directly to your person rss feed.
Create Custom RSS FeedSign up and join over 5,000 professional members who receive personalized news alerts, curated professional connections, and more for free!
Nvidia beats expectations, reporting $115.8bn in revenue and raising its long-term growth outlook, but the stock still struggled to sustain its gains. AI remains fundamentally strong, but investor expectations are becoming more demanding, particularly around capex and profitability. Wall Street suffered a major sell-off, with the S&P 500 entering a six-session losing streak as rate concerns intensified.
iSAM Securities reviews the ris of weekend gold trading
Webull Corporation reported record third quarter 2026 revenue of $218.7 million, up 39% year-on-year, with customer assets reaching $32.4 billion and options contracts volume up 79%. Net income attributable to the company was $31.2 million, while margin debit balances passed $1 billion for the first time.
Anthropic, the company behind the Claude family of AI models, begins trading on the Nasdaq today under the ticker ANT. It priced its shares at $83 last night, above its marketed range of $70 to $78, and raised about $81.3 billion. That makes it the largest initial public offering on record, ahead of the roughly $75 billion SpaceX raised in June. This note covers what investors need to know: the terms, the business, how the company is governed, and what to watch.
Nvidia's first results without Jensen Huang answered the question that has hung over the AI trade since October. Revenue of $115.8 billion beat consensus by about $7 billion, fourth-quarter guidance of $130 billion came in roughly $5 billion above expectations, and the company raised its outlook for next fiscal year to around 75% growth. All of this assumes no data-centre sales to China.
Marex has entered the football financing market through a partnership with specialist sports investment and advisory firm Pinto Capital, targeting clubs in the Premier League and EFL Championship.
Around 110,000 UK retail investors have secured $300 million worth of Anthropic shares in its record-breaking $81 billion IPO. The heavily oversubscribed offer, coordinated by RetailBook, saw smaller investors prioritised, with 63% of applicants receiving their full allocation.
Clear Street has completed its acquisition of Boom Securities (H.K.) Limited, establishing its first licensed brokerage presence in Hong Kong
Sterling slips to its lowest against the dollar since October as markets trim Bank of England bets and Fed minutes point to further US rate rises, while the euro hits a fresh one-year low. Daily FX analysis from Equals.
JT Prime, the institutional Prime of Prime founded by Raj Sitlani, Jonathan Brewer and Jeff Wilkins, is set to become the new home for institutional client relationships currently serviced by FXCM Pro. Clients have been offered the same leverage, fees and connectivity, ensuring continuity of trading conditions.