

Explore Companies BySectors & Categories
Explore Companies ByUse Cases
Explore Companies ByProducts & Services
Explore Companies ByRankings & Reviews
Featured NewsCompaniesMarketsCryptoTechRegulatoryCommentaryUKUSWorldMore

    Latest Wires

      Daily Newsletter

      LF Daily News

      Daily industry focused newsletter giving you an overview for the financial & finTech industry.

      See All Newsletters
      By clicking "Sign Up" you are agreeing to our Terms of Service and Privacy Policy

      BTC/USD Price Action Forecast Update Today: Did the $66,070–$65,470 Resistance Trigger Bitcoin's Next Move?

      Published: just now

      BTC/USD Price Action Forecast Update Today: Did the $66,070–$65,470 Resistance Trigger Bitcoin's Next Move?

      Post illustration


      In the previous analysis, "BTC/USD Price Action Forecast Today: Is the $66,070–$65,470 Resistance the Key to Bitcoin's Next Move?", I highlighted that Bitcoin was approaching a major technical decision point. While the weekly trend remained bearish, the daily chart was consolidating, with two possible scenarios based on how price reacted at key support and resistance levels.

      That is exactly what happened.


      Bitcoin BTC/USD failed to break above the $65,470–$66,070 resistance level, allowing sellers to remain in control. Rather than predicting the market, the analysis focused on waiting for price confirmation before executing a trade.


      Key takeaways:

      1. Bitcoin failed to break above the $66,070–$65,470 resistance level.
      2. Sellers held control, validating a bearish break-and-retest setup.
      3. A stop-loss wicked out or liquidity sweep occurred right before the price dropped.
      4. Waiting for daily confirmation prevented an unnecessary losing long position.


      How did the previous BTC/USD price action signal the move?


      Post illustration


      The previous forecast identified several technical factors that favored further downside:


      1. Bearish weekly market structure.
      2. Rejection from a major weekly and daily resistance level.
      3. 50 EMA acting as dynamic resistance.
      4. Lower high (LH) maintaining bearish momentum.
      5. Daily consolidation awaiting confirmation.
      6. High-probability break-and-retest setup.
      7. A completed retest of the neckline of Head and Shoulders reversal pattern.


      Instead of chasing price, the analysis emphasized waiting for confirmation before entering the trade.


      For the complete technical breakdown, including the weekly and daily chart analysis, major support and resistance levels, and the original trade plan, read the previous forecast:

      1. BTC/USD Price Action Forecast Today: Is the $66,070–$65,470 Resistance the Key to Bitcoin's Next Move?


      Forecast recap: What was anticipated on BTC/USD before the move?


      Before Bitcoin BTC/USD made its next directional move, two possible scenarios were outlined based on market structure and price action.


      Watch the previous live trading session to see how the BTC/USD setup was identified before the move happened:


      Jump to 12:00 –16:05 for a detailed BTC/USD price action breakdown, including market structure, key resistance, trade confirmation, and the analysis behind the setup.


      BTC/USD price action forecast: What were the two key scenarios?


      1. Bullish scenario (Lower-probability setup)

      Post illustration

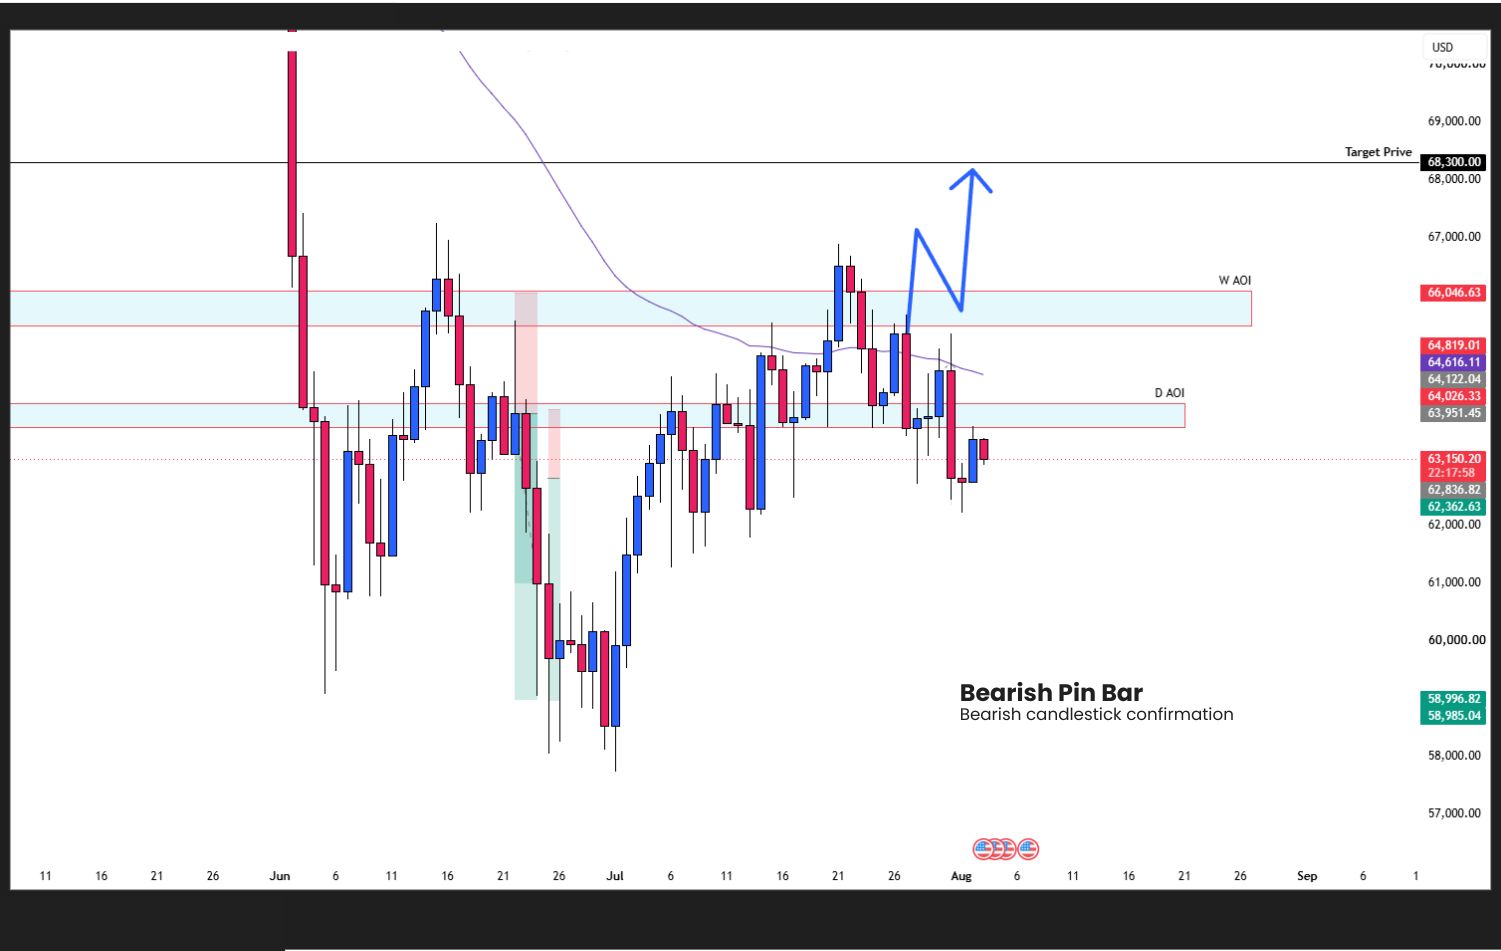
      Daily Chart Price Action Analysis. Anticipated Bullish Setup


      A bullish continuation was only expected if buyers could prove they had regained control of the higher-timeframe resistance.


      Bullish confirmation checklist:

      1. BTC/USD breaks and successfully retests the $65,470–$66,070 weekly resistance level.
      2. Proper breakout of weekly resistance level.
      3. Breakout of the consolidation level.
      4. Confirm bullish candlestick rejections after the retest before considering continuation to the upside.


      Anticipated bullish trade idea:

      1. Take profit: $68,300
      2. Stop-loss: Below the newly established support after the breakout.
      3. Risk management: Use proper position sizing.


      Why was the BTC/USD bullish setup considered a low-probability trade?


      This setup went against the dominant bearish trend visible on the weekly timeframe, making it the lower-probability scenario.


      Outcome:


      Post illustration


      Daily Chart Price Action Analysis. Bullish Bias Setup Invalidated

      Post illustration


      Daily Chart Price Action Analysis. Price Failed to Break Above Weekly Resistance

      Following the trading plan helped traders avoid an unnecessary long position.

      1. ✅ No confirmed breakout above $65,470–$66,070 resistance.
      2. ✅ No valid bullish confirmation formed.
      3. ✅ Bullish setup invalidated.
      4. ✅ Potential losses avoided.

      ______________________________________________________________________________________

      Want to improve your price action trading?

      Learn how to identify high-probability trading opportunities with these guides:

      1. A Guide to Master a Price Action Strategy That Works in Any Market: Complete Guide on How to Trade with Market Structure + Support & Resistance (Step-by-Step)
      2. A Guide to Master a Strategy that Works in Any Market: How to Identify Support and Resistance Levels?
      3. The Top Japanese Candlestick Patterns to Trade: Mastering Japanese Candlestick Confirmation + Pairing with Price Action Analysis
      4. The Top Japanese Candlestick Patterns to Trade: How to Use the Engulfing Candlestick as a High-Probability Entry Signal
      5. Master Exponential Moving Average: How to Trade using EMA Indicator with Price Action Analysis?
      6. Reversal Chart Patterns: The Complete Guide to Spotting Bullish and Bearish Trend Reversal Pattern in Trading
      7. How to Step-by-Step Swing Trade with Pure Technical Price Action Analysis?

      ______________________________________________________________________________________


      2. Bearish scenario (Higher-probability setup)


      Post illustration

      Daily Chart Price Action Analysis. Anticipated Bearish Setup


      The preferred trading plan was to look for selling opportunities that aligned with the dominant bearish trend.


      Bearish confirmation checklist:

      1. BTC/USD breaks and successfully retests the $64,060–$63,440 support zone.
      2. Previous support turns into new resistance.
      3. A strong bearish rejection candlestick confirms sellers are back in control.


      Anticipated bearish trade idea:

      1. Target: $62,100
      2. Stop-loss: Above the new resistance zone.
      3. Risk management: Use proper position sizing.
      4. Additional Confirmation: Potential validation of the Head and Shoulders reversal

      pattern.


      Why was the BTC/USD bearish setup considered a higher-probability trade?


      This bearish setup aligned with the dominant bearish trend on the weekly timeframe while also following the break-and-retest confirmation on the daily chart, making it the higher-probability trade.


      Outcome:


      Post illustration

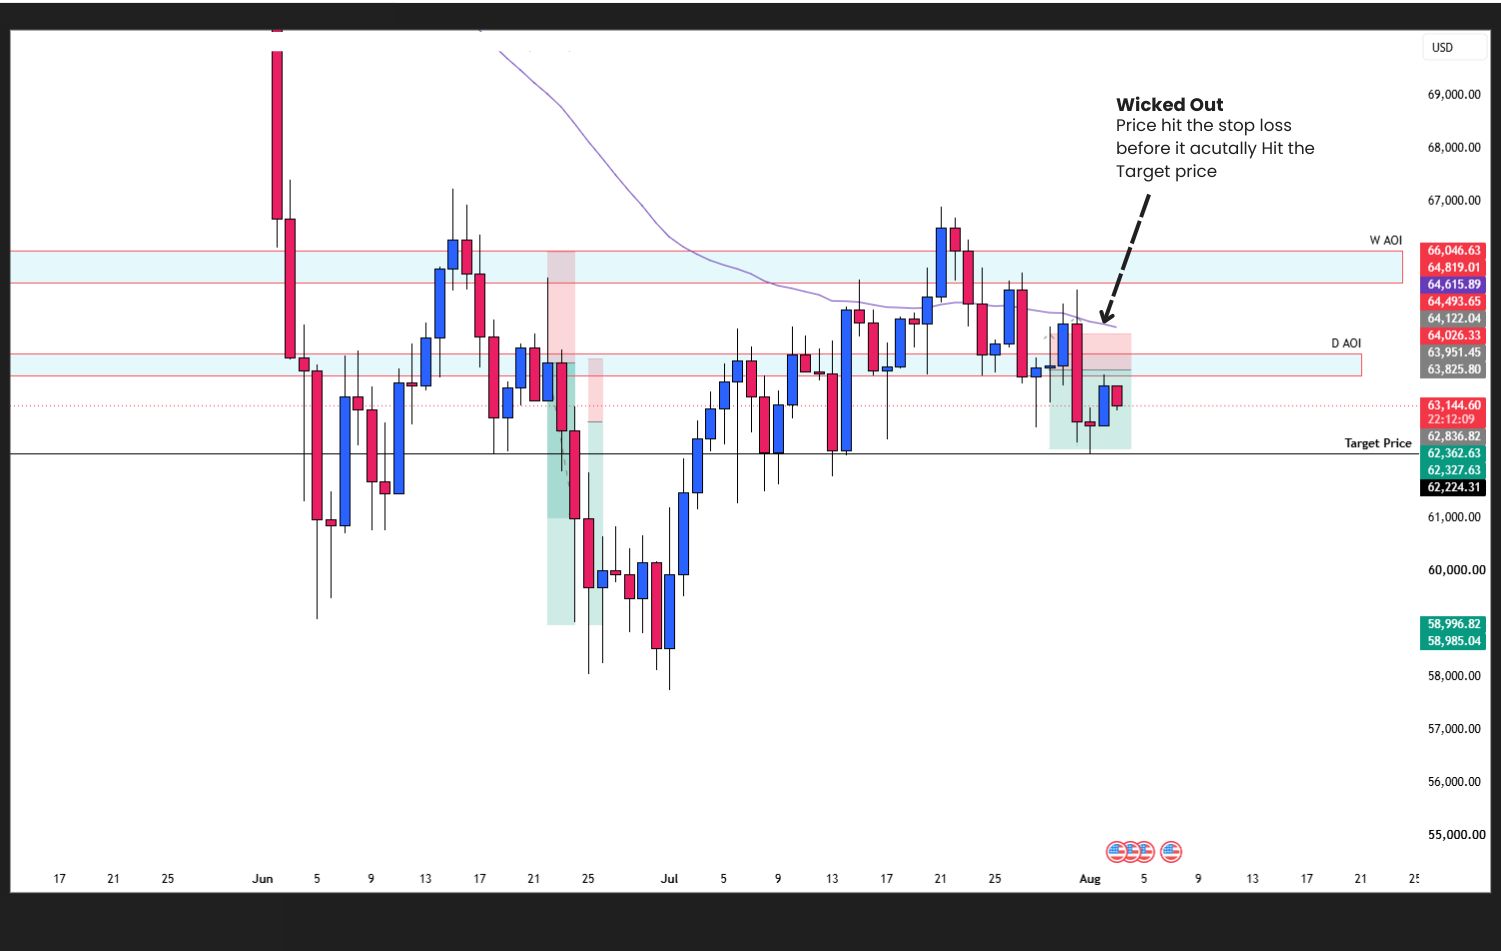
      Daily Chart Price Action Analysis. Bearish Bias Setup Validated but Wicked out before the Move Happened

      Post illustration


      Daily Chart Price Action Analysis. Bullish Bias Setup Validated
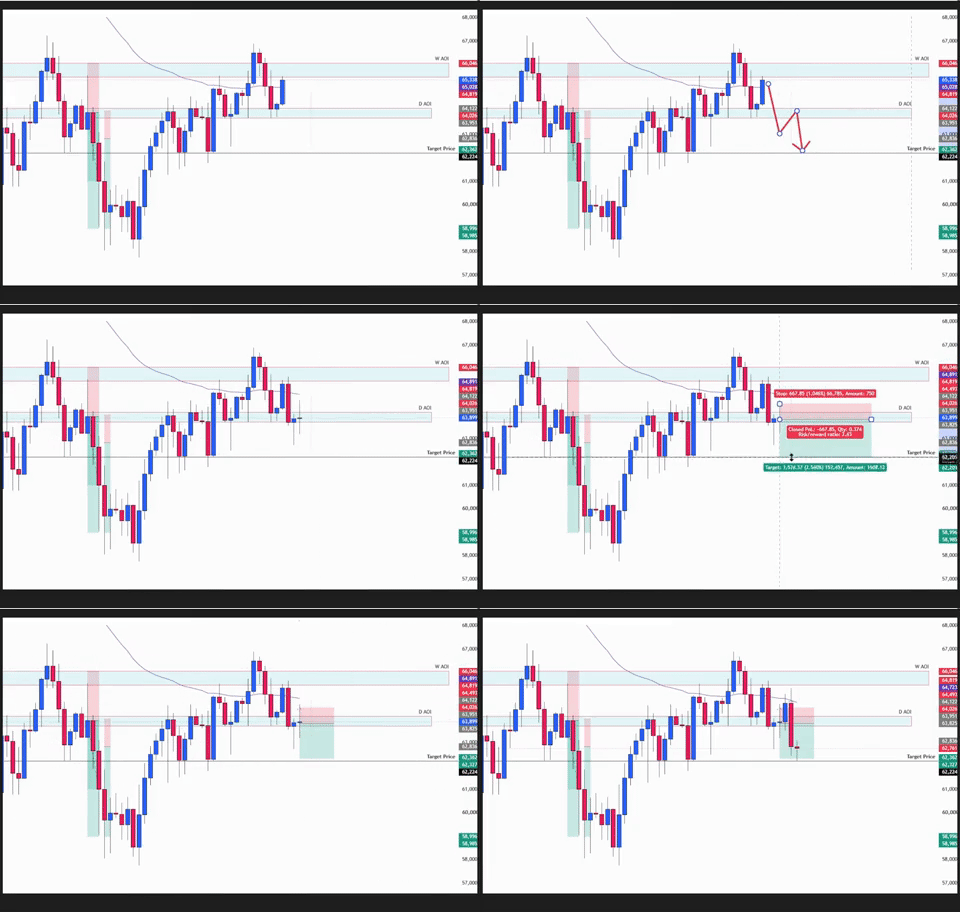
      1. ✅ Support successfully broken.
      2. ✅ Break-and-retest confirmed.
      3. ✅ Bearish rejection candlestick formed.
      4. ✅ Sellers regained control.
      5. ✅ Bearish continuation followed the anticipated technical roadmap toward the downside.
      6. ✅ Stop loss was wicked out before Bitcoin continued to reach the target price.


      How was this BTC/USD setup successfully executed?


      Trade outcome: The Bitcoin (BTC/USD) bearish continuation was correctly anticipated, but the stop loss was swept out by a liquidity wick before price reached the target


      Post illustration


      Bitcoin respected the technical levels identified before the move, reinforcing the value of waiting for confirmation rather than predicting price direction.


      The setup was based entirely on the confluence of:

      1. ✅ Price action
      2. ✅ Market structure
      3. ✅ Support and resistance
      4. ✅ Reversal pattern
      5. ✅ Break-and-retest setup
      6. ✅ Candlestick confirmation
      7. ✅ 50 EMA trend confirmation
      8. ✅ Proper risk management
      Although the stop loss was triggered by a temporary liquidity sweep, the overall bearish analysis remained valid, and Bitcoin ultimately reached the projected target.


      Final take


      Post illustration


      This BTC/USD Price Action Forecast Update demonstrates how combining price action, market structure, support and resistance, break-and-retest setups, candlestick confirmation, and the 50 EMA can help traders identify high-probability opportunities.


      It also reinforces one of the most important lessons in trading: confirmation comes before execution!


      Always remember:

      While no strategy can eliminate stop-loss wicks or liquidity sweeps, consistently following a disciplined trading plan and proper risk management provides the best chance of long-term success.

      ______________________________________________________________________________________

      FAQs

      Was the BTC/USD forecast accurate?

      Yes. The forecast correctly identified the bearish trend, and Bitcoin reached the projected downside target after confirming the break-and-retest setup.

      Why was the stop loss hit before the target?

      Bitcoin experienced a liquidity sweep that briefly wicked out the stop loss before continuing lower to the target. This is common in volatile markets.

      Why was the bearish BTC/USD setup higher probability?

      The setup aligned with the weekly bearish trend and was confirmed by market structure, support and resistance, a break-and-retest, bearish candlestick confirmation, and the 50 EMA.

      Why did the bullish BTC/USD setup fail?

      Bitcoin failed to break and hold above the $65,470–$66,070 resistance zone, so no valid bullish confirmation was formed.

      What trading strategy was used?

      The analysis used a price action trading strategy based on market structure, support and resistance, break-and-retest confirmation, candlestick patterns, the 50 EMA, and disciplined risk management.

      What is the key lesson from this Bitcoin trade?

      Wait for price confirmation, not predictions. High-probability BTC/USD setups can still experience stop-loss wicks before reaching their target, making risk management essential.

      ______________________________________________________________________________________

      If you want to develop a professional trading mindset while learning how to identify high-probability price action setups across Gold, Forex, Crypto, Commodities and Indices, continue following our market analysis and educational guides.

      Your next step is:

      1. To know trader’s beginner steps before your trade
      2. Mastering your psychology
      3. Mastering the simple price action strategy
      4. Mastering Repetitive Patterns in Trading
      5. Trading live using this simple price action strategy

      For more in-depth market breakdowns, real-time analysis, and structured learning content, you can join our Discord community inside ACY Server:

      Discord Server - ACY Securities Server

      Start your live trading journey today!

      • Trade Forex, indices, gold, crypto and other global markets

      • Access powerful platforms including ACY, MT4, MT5, and Copy Trading tools

      Move from learning simple price action to executing it in the real market with confidence!

      Create an Account. Start Your Live Trading Now!

      Check out my contents:

      Beginners path

      Build a strong trading foundation with step-by-step lessons designed for beginners:

      1. Beginner Trading Steps: 4 Rules to Follow Before You Trade
      2. Beginner Trading Steps: Mistakes That Can Slow Down Your Progress (And How to Avoid Them)
      3. The 1% Risk Rule: The Most Common Mistakes That Quietly Destroys 90% of Traders
      4. Habits of a Successful Traders: What are the 4 Ways to Build Discipline in Trading?
      5. Beginner Trading Guide: The Complete Beginner's Roadmap to Smarter Trading (Step-by-Step)
      6. A Complete Beginner's Guide: What are the Only Technical Trading System You Need to Trade Gold, Forex, Crypto, Commodities & Indices?

      Mastering popular forex pairs using simple price action strategy

      Ready to learn simple price action strategy? Here’s how to do it step by step:

      1. USD/JPY Analysis Today: Simple Trades, Clear Moves, for Beginners Using Price Action
      2. Simple Day Trade Price Action On EUR/USD: Why the Drop to 1.14190?
      3. Simple Price Action Analysis on EUR/CAD: EURCAD the Pair for the Week?
      4. Simple Price Action Strategy on USD/ CHF: 0.80000 the Key Ceiling for USD/CHF Sell?
      5. Price Action Analysis for GBPCAD Trade: A Potential Trade for This Week or Next Week?
      6. EUR/GBP Trading Guide: How to Spot High-Probability Setup a Week Ahead Using Simple Price Action Strategy?
      7. Simple Price Action Trade on CAD/JPY: 115.000 the Key Floor for CAD/JPY Buy?
      8. USD/JPY Price Action Outlook: Is 158.500 the Key Floor for a Potential New High?
      9. CAD/JPY Price Action Breakdown: We Anticipated the Move Twice to 116.500, Is Price Action Really the King?
      10. GBP/NZD Trade Ideas Using Simple Price Action Strategy: Will Price Drops to 2.28000?
      11. USD/JPY Technical Forecast: 158.500 Floor Retest for Preparing for New Highs?
      12. GBP/CHF Price Action Ideas: Is 1.05500 the Ceiling for a New Low?
      13. GBP/CAD Simple Forex Price Action Ideas: Is the 1.84500 Support Level Holding?
      14. AUD/USD Simple Price Action Forecast: Why Buy at 0.71700 Support Area?
      15. GBP/NZD Price Action Idea: Is GPB/NZD 2.3000 Key Floor for Bullish Continuation?
      16. GBP/USD Price Action: Trade Setups on a Ranging Market?
      17. USD/CAD Simple Price Action: Is 1.36500 the Key Bullish Floor?
      18. USD/CAD Price Action Ideas: Setting Up for the Next Bullish Push?
      19. EUR/JPY Price Action: Is It Retesting a Reversal Pattern?
      20. NZD/USD Forecast: Potential Consolidation Breakout on NZD/USD?
      21. AUD/JPY Price Action Forecast: Is AUD/JPY Setting Up for a Massive Sell?
      22. NZD/USD Price Action Forecast: Is a Reverse Double Top Pattern Forming?
      23. NZD/USD Price Action Forecast: Is a Reverse Double Top Pattern Forming?
      24. AUD/CHF Forex Price Action Idea: Are Sellers Defending the 0.56504–0.56200 Key Level?
      25. AUD/CHF Price Action Forecast: Price Breaks Below Consolidation, What's Next?
      26. EUR/USD Forecast Today: Can NFP News Today Push EUR/USD Down to 1.13000?
      27. EURCHF Price Action Forecast: Is a Bearish Double Top Signaling a Major Drop?
      28. EUR/USD Price Action Forecast Today: Will the 1.14150–1.14520 Resistance Trigger a Drop to 1.13500?
      29. EUR/USD Price Action Forecast Update Today: Is the 1.1410 – 1.4520 Resistance Level Still Potentially Trigger a Drop?
      30. GBP/AUD Price Action Forecast Today: Will the British Pound or Australian Dollar Come Out on Top?

      Master how to identify market trend

      Learn how to identify bullish, bearish, and sideways markets using price action to make more informed trading decisions:

      1. A Guide to Master Price Action Strategy that Works in Any Market: How to Master the Trend in Trading Any Market
      2. A Guide to Master a Strategy that Works in any Market: The Structure of a Market Trend
      3. A Guide to Master a Price Action Strategy That Works in Any Market: Complete Guide on How to Trade with Market Structure + Support & Resistance (Step-by-Step)

      Learn of how to identify support and resistance

      1. A Guide to Master a Strategy that Works in Any Market: How to Identify Support and Resistance Levels?
      2. A Guide to Master a Price Action Strategy That Works in Any Market: Complete Guide on How to Trade with Market Structure + Support & Resistance (Step-by-Step)

      Master how to use break & retest pattern

      Ready to learn and capitalize the repetitive patterns in the markets? Here’s how to do it step by step:

      1. Break and Retest: A Simple Repetitive Price Action Pattern?
      2. Break and Retest: How to Capitalize Repetitive Patterns in Trading?
      3. EUR/JPY Price Action: Is It Retesting a Reversal Pattern?
      4. False Breakouts: How to Avoid Breakout Traps and Trade Smarter?

      Master how to use candlestick confirmation & patterns

      Discover how candlestick patterns can help confirm market direction:

      1. The Top Japanese Candlestick Patterns to Trade: Mastering Japanese Candlestick Confirmation + Pairing with Price Action Analysis
      2. The Top Japanese Candlestick Patterns to Trade: How to Use the Engulfing Candlestick as a High-Probability Entry Signal
      3. Bullish and Bearish Pin Bar Candlestick: The Complete Guide to Trading Reversal Candlestick Confirmations

      Master the art of trading trend reversal patterns

      1. Reversal Chart Patterns: The Complete Guide to Spotting Bullish and Bearish Trend Reversal Pattern in Trading

      Mastering the 50 EMA

      1. Master Exponential Moving Average: How to Trade using EMA Indicator with Price Action Analysis?

      Learn how to trade Gold

      Gold is still one of the most traded assets, here’s how to trade it with confidence:

      1. XAUUSD Price Action: A Beginner Buy Setup for Next Week
      2. How to Trade Gold Using Simple Price Action Outlook: 4500 the Key Zone for XAUUSD Buys?
      3. The Simplest Way to Trade XAU/USD Using Price Action Analysis: Buy and Sell Anticipation on Gold?
      4. XAU/USD Price Action: Will Gold Rally to $4,900 Today?
      5. Gold (XAU/USD) Price Action Forecast: Will XAU/USD Drop to $4650?
      6. Gold (XAU/USD) Trade Ideas: A Simple Price Action Analysis on Gold This Week?
      7. Gold (XAU/USD) Price Action Idea: A High-Probability Trade Setup on Gold?
      8. Gold XAU/USD Price Action Idea: Is a Bullish Momentum Coming?
      9. Gold (XAU/USD) Price Action Ideas: Will News Trigger a Breakout or Consolidation on Gold?
      10. How to Step-by-Step Swing Trade Gold (XAU/USD) with Pure Technical Price Action Analysis?
      11. Gold XAU/USD Price Action Forecast: Anticipating a Consolidation Breakout on Gold Again?
      12. Gold XAU/USD Price Action News Forecast Today: Can XAU/USD Break Above the $4,200–$4,190 Resistance Zone or Hold?
      13. Gold XAU/USD Forecast Update Today: How the $4,200–$4,190 Resistance Zone Triggered the Selloff?
      14. Gold (XAU/USD) Price Action Forecast Update Today: Is the Double Top Pattern Signaling Another Gold Selloff?
      15. Gold (XAU/USD) Price Action Forecast Update Today: Did the Double Top Pattern Trigger the Massive Selloff?
      16. Gold (XAU/USD) Price Action Forecast Update Today: Could Gold Price Still Drop to $3,930?
      17. Gold XAUUSD Price action Forecast: Is the Gold Breakout the Next Big Move?

      Swing trading 101

      1. How to Step-by-Step Swing Trade Gold (XAU/USD) with Pure Technical Price Action Analysis?

      Learn how to trade crypto with price action strategy

      1. Bitcoin BTC/USD Price Action: Could Bitcoin Still Keep Dropping?
      2. Bitcoin (BTC/USD) Price Action Insight: Could Bitcoin Still Drop to $58,000?
      3. Bitcoin (BTC/USD) Forecast Update: Has the $58,000 Correction Ended?
      4. BTC USD Price Action Forecast Today: Is the $66,070 – $65,470 Resistance the Key to Bitcoin's Next Move?

      Mastering trader's mindset

      Your mindset is what separates steady growth from costly mistakes. Focus on these essentials:

      1. Trading Mindset: Why Trading Exposes Who You Really Are?
      2. Consistency in Trading is Key: Why Discipline Beats Intelligence?
      3. Overtrading: Why More Trades Do Not Mean More Profits?
      4. Trading Wick Outs: How to Handle Fake Outs and Market Losses?
      5. Trading Psychology: The Truth About Trading Success
      6. Deliberate Practice in Trading: Why Intentional Practice Beats More Screen Time?
      7. Trading Psychology: Why Most Traders Struggle With Consistency? (And It Has Nothing to Do With the Market)
      8. Mastering the Three Pillars of Profitable Trading: Risk Management, Trading Strategy, and Trading Psychology
      9. The Mental Game of Trading: How to Overcome Trading Hesitation and Execute Trades with Confidence?

      Professional trader's mindset masterclass

      Develop the mindset of a professional trader by mastering discipline, emotional control, patience, and consistency to achieve long-term trading success:

      1. Trading Psychology: Why the Mindset of a Profitable Traders Separates from Everyone Else?
      2. The Professional Trader's Mindset: 6 Psychological Traits Every Consistently Profitable Trader Needs

      Risk management series

      Learn the essential risk management strategies to protect your capital, manage losses, and trade with confidence:

      1. Risk Management in Trading: What Is the Secret to Long-Term Trading Success?

      Beginner trading roadmap

      Not sure where to begin? Here’s a simple roadmap to guide you:

      1. Common beginner Traders Mistakes → avoid overtrading, revenge trading, and chasing the market.
      2. Master Traders Psychology → build discipline, patience, and emotional control
      3. Mastering Risk Management → learn how to have a sustainable trading.
      4. Master Simple Technical strategies & Indicators → especially price action, key levels, and market structure.
      5. Applying to Real Market → forex, crypto and indices.


      By building step by step; from basics → real trading → mastering the craft, you’ll gain clarity, confidence, and steady progress without ever feeling overwhelmed.

      Follow me for more daily market and educational insights!


      Ruffy Grant B. Capacio - LinkedIn | Telegram | YouTube

      Acy Securities - Discord


      Disclaimer:

      Trading forex and derivative instruments involves substantial risk and may not be suitable for all individuals. Only use funds that you are prepared to lose. It is important to understand how these markets work and the risks involved before trading, and to seek independent financial advice if needed. All market analysis and insights shared are intended for educational and informational purposes only and should not be considered financial or investment advice. August 3, 2026.

      ACY Securities is one of Australia's fastest growing multi-asset online trading providers, offering ultra-low-cost trading, rock-solid execution, technologically superior account management and premium market analysis.

      This content may have been written by a third party. LiquidityFinder makes no representation or warranty and assumes no liability as to the accuracy or completeness of the information provided, nor any loss arising from any investment based on a recommendation, forecast or other information supplies by any third-party. This content is information only, and does not constitute financial, investment or other advice on which you can rely.
      Comments
      Most Recent
      Written By
      Daily Newsletter

      LF Daily News

      Daily industry focused newsletter giving you an overview for the financial & finTech industry.

      See All Newsletters
      By clicking "Sign Up" you are agreeing to our Terms of Service and Privacy Policy
      RSS Feeds

      Create a custom RSS Feed

      Select the categories and companies you wish to follow directly to your person rss feed.

      Create Custom RSS Feed

      Related Categories:

      Related Tags:

      #TradingPlatform#LiquidityFinder#MarketNews#FinTech

      Related Articles:

      Find The Right Partners for
      Your Trading Business

      Sign up and join over 5,000 professional members who receive personalized news alerts, curated professional connections, and more for free!

      Create Your FREE Account
      Get access to latest news, updates, real-time data, brokerage and trading firm insights and customized information feeds.

      Institutional brokerage and financial infrastructure provider Clear Street has joined TradingView’s broker network, allowing its clients to trade US stocks, exchange-traded funds and options directly through the charting and analysis platform.

      just now

      Learn how to improve trading psychology, manage fear and greed, avoid revenge trading, and follow your trading strategy with discipline and a trading journal.

      just now

      GTC Prime has announced a strategic partnership with Centroid Solutions to manage and distribute its liquidity through CS 360 Bridge, Centroid's multi-asset connectivity and execution engine, giving brokers and institutional clients access to tailor-made pricing, low-latency execution and real-time risk management.

      just now

      CMC Markets Founder and CEO, Lord Peter Cruddas, discusses the structural evolution of the Group, the accelerating opportunity across B2B and institutional markets, major global partnerships including Revolut, Westpac, and ASB, and his outlook for the remainder of the financial year ahead.

      just now

      Clear Street has announced an exclusive partnership with Seawolf Capital to bring market commentary from Danny Moses, Vincent Daniel and Porter Collins to its clients and the wider investing community, including live market calls, digital content and events. New programming will sit alongside Seawolf's podcast.

      just now

      Yields are surging. But is inflation really the reason? This week’s BitDelta Pro Weekly Outlook looks beyond the headline explanation to examine what is actually driving the move in rates, and what that could mean across equities, credit and commodities. We also explore the growing importance of balance-sheet quality, the signals emerging from the AI infrastructure cycle, and what oil and gold may be telling markets about the current macro regime. Read the full Weekly Outlook. BitDelta Securities Financial Services LLC, regulated by the Capital Market Authority under Category 5 (Introduction Only), acts solely as an introducer and does not provide trading, execution, dealing, advisory, portfolio management, or custody services. All trading, execution, and investment-related services are provided by BitDelta Limited, Mauritius, a licensed Investment Dealer. All trading and investments involve risk. The value of investments may fluctuate, and you may receive less than your initial investment.

      just now

      Devexperts has appointed Rainer Fuchsluger as Global Group Chief Executive Officer, effective immediately. His career spans LSEG, Wolters Kluwer, SS&C and Thomson Reuters, and he follows Ben Hurley, who was CEO for two years. His mandate covers international growth, cloud computing and AI across the portfolio.

      just now

      ATFX has been named Best Global Forex Broker at Forex Expo Dubai 2026, held on 22 and 23 September at the Dubai World Trade Centre. ATFX MENA's Mohammad Shanti also presented on designing currency pairs and FX portfolios for 2026 macro regimes at the event, which drew more than 23,000 attendees and 270 exhibitors.

      just now

      Yapı Kredi Kripto has selected Integral's digital asset trading technology for its soon-to-launch regulated cryptocurrency business in Türkiye. The deployment covers pricing, liquidity and risk management as the country's new digital asset framework comes into effect, building on an FX relationship with Yapı Kredi.

      just now

      AUDJPY price forecast: Watch resistance at 110.045–110.403 for bearish rejection toward 109.283 or a bullish breakout targeting 111.550.


      just now
      Feed