
just now


Liquidity Finder Ltd is incorporated in England and Wales, company number 10610740, registered address 167-169 Great Portland Street, Fifth Floor, London W1W 5PF, United Kingdom.
Published: just now


The Gold (XAUUSD) price forecast remains cautiously bullish on the weekly timeframe as price shows bullish rejection around the $4,000–$4,095 support zone. This reaction suggests buyers are defending a potential higher low within the broader bullish structure.
However, the daily chart presents a weaker picture. Gold remains below the 50 EMA, while the $4,175–$4,195 daily resistance zone continues to limit recovery attempts. Price is consolidating between weekly support and daily resistance, leaving the next directional move unconfirmed.
A confirmed breakout above daily resistance could strengthen the bullish scenario toward $4,265. Alternatively, a sustained breakdown below weekly support would weaken the broader bullish structure and bring $3,935 into focus.
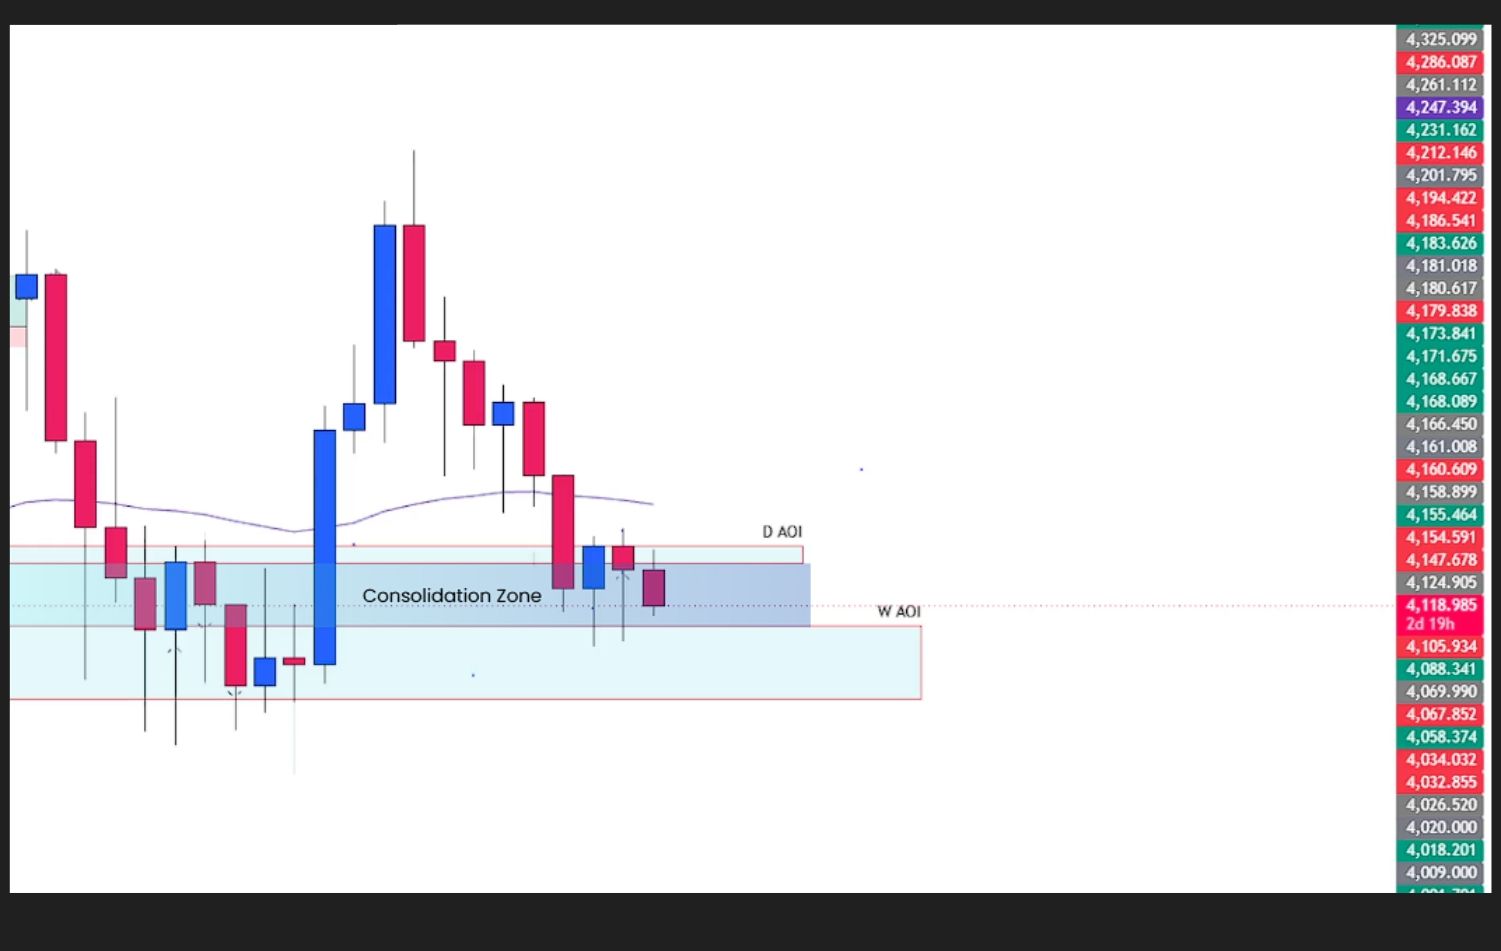
Daily Timeframe Price Action Analysis. Repeated Rejections at Weekly Support Signal Buying Interest.
The weekly gold chart shows a broader bullish structure, with price reacting around a potential higher low at the $4,000–$4,095 support zone.
Understanding gold market structure and XAUUSD trends helps distinguish a pullback within a bullish trend from a developing bearish reversal.

Daily Timeframe Price Action Analysis. Gold Consolidates Below the 50 EMA as $4,175–$4,195 Resistance Limits Recovery.
Bullish rejection in this area suggests that attempts to push gold lower are meeting buying interest. If buyers continue defending support, the reaction could provide a foundation for another move higher.
However, the support reaction has not yet developed into confirmed bullish continuation. Daily resistance remains overhead, keeping price inside a consolidation range.
Key weekly observations include:
Learning how to mark gold support and resistance on the weekly chart provides a framework for identifying the area buyers need to defend.
A sustained move away from support would strengthen the bullish interpretation. Any rejection on an unfinished weekly candle should also be assessed against its eventual close.
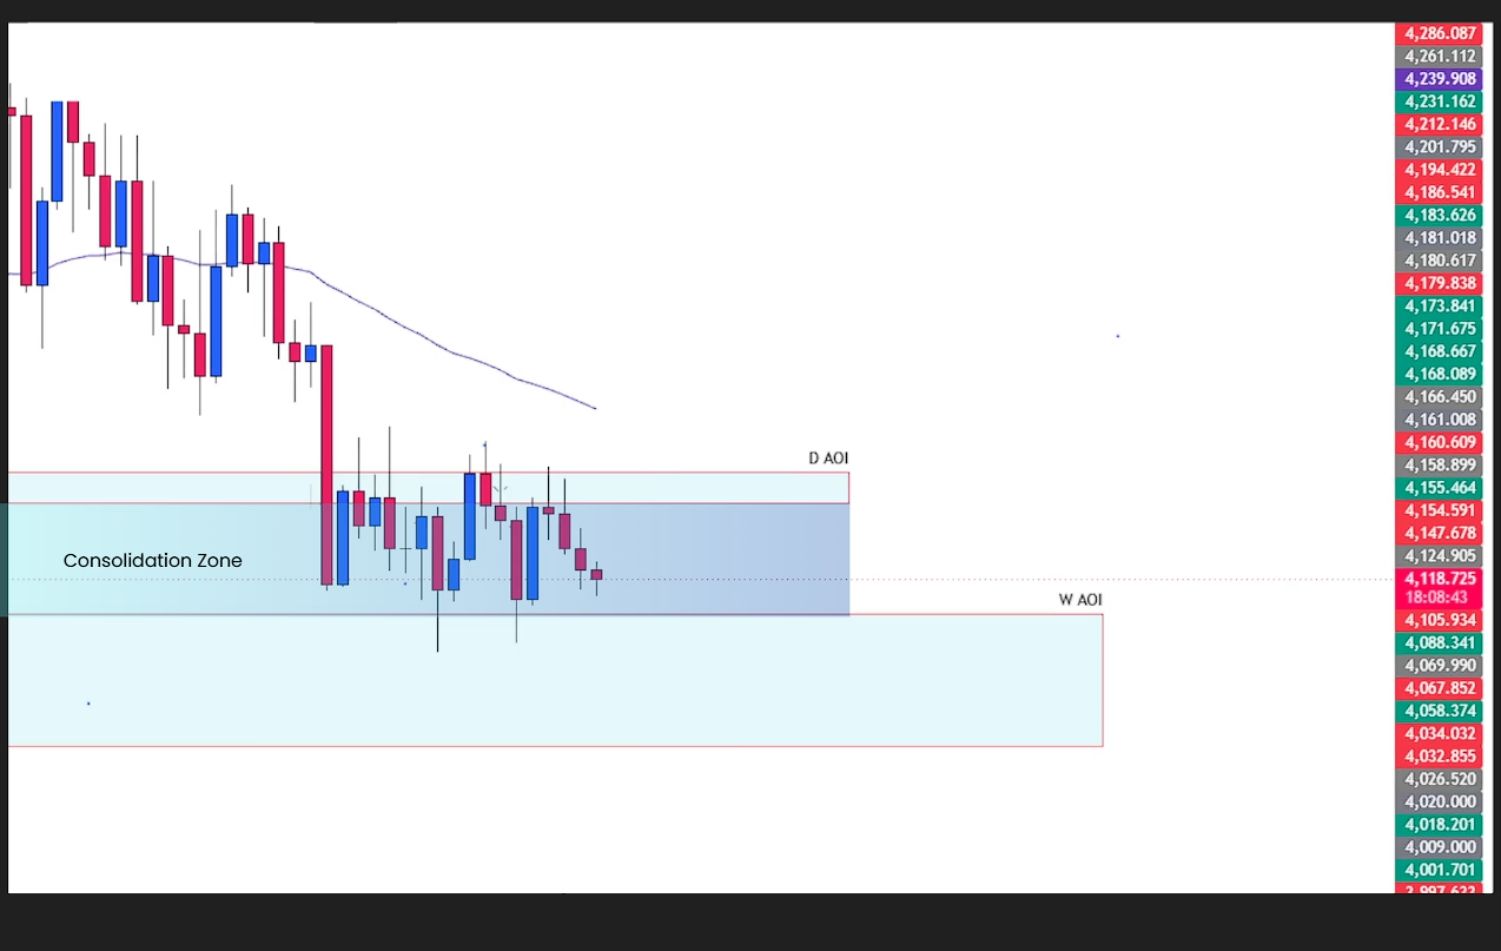
Daily Timeframe Price Action Analysis. Market Structure Signals a Bearish Trend.
The daily gold chart shows a bearish structure within the broader weekly consolidation.
Price remains below the 50 EMA, supporting a bearish daily bias. Combining the EMA indicator with price action analysis helps assess this trend reference alongside swing highs, swing lows and key levels.
However, the moving average alone does not confirm that a fresh decline is underway, particularly while price continues moving sideways.
Daily Timeframe Price Action Analysis. Gold Consolidates Below the 50 EMA as $4,175–$4,195 Resistance Limits Recovery.
The $4,175–$4,195 resistance zone remains an important barrier. Buyers need to overcome this area and the latest daily lower high to provide stronger evidence of a structural shift.
This creates a mixed timeframe outlook: weekly support is attracting buyers, but the daily structure has not yet confirmed a bullish reversal.
Until price breaks out with follow-through, both bullish and bearish scenarios remain conditional.
Identifying XAUUSD support and resistance levels helps define where gold’s next bullish or bearish scenario could develop.
| Technical Level | Significance |
| $4,000–$4,095 | Weekly support zone where buyers are showing rejection |
| $4,095 | Upper boundary of weekly support |
| $4,000 | Lower boundary; a decisive breakdown would threaten the broader support zone |
| $4,175–$4,195 | Daily resistance zone that buyers need to reclaim |
| Latest daily lower high | Structural reference for confirming a potential bullish shift |
| $4,265 | Potential upside target following a confirmed bullish breakout |
| $3,935 | Potential downside target following a confirmed support breakdown |
| 50 EMA | Daily trend reference currently positioned above price |
A move below $4,095 would take gold deeper into the support zone. A decisive close below $4,000 would provide stronger evidence that the entire zone has failed.
Similarly, entering the resistance zone is different from clearing it. A daily close above $4,195, followed by a successful retest, would strengthen the bullish breakout case.

Daily Timeframe Price Action Analysis. Bullish Breakout and Retest Scenario Toward $4,265.
The bullish scenario depends on gold progressing beyond its weekly support reaction and breaking the bearish daily structure.
The first development to monitor is a break above the latest daily lower high. Gold would also need to clear the $4,175–$4,195 daily resistance zone, showing that buyers can overcome the area currently limiting gains.
Following the breakout, a pullback that holds former resistance as support would strengthen the setup. This break and retest price action pattern helps assess whether buyers can maintain control after resistance gives way.

Daily Timeframe Price Action Analysis: Conditional Bullish Objective
Upward follow-through strengthens the potential move toward $4,265.
A recovery above the daily 50 EMA would provide additional supporting evidence. The central requirement remains a confirmed structural break and a successful retest.
Bullish confirmation sequence: Lower-high break → resistance breakout → support retest → bullish candle close → upward follow-through.
If price breaks above resistance but quickly falls back below the zone, the breakout would lose credibility.

Daily Timeframe Price Action Analysis: Bearish Breakdown and Retest Scenario Toward $3,935.
The bearish scenario would strengthen if gold forms a new daily lower low and sellers push price through weekly support.
Because $4,000–$4,095 is a zone, trading below its upper boundary does not confirm a complete breakdown. Buyers could still respond within the area.
A decisive daily close below $4,000, followed by a failed recovery into former support, would provide stronger evidence of seller control. Combining market structure with support and resistance helps assess whether that move represents a sustained bearish shift.

Daily Timeframe Price Action Analysis: Conditional Bearish Objective
Downward follow-through strengthens the potential move toward $3,935.
Bearish confirmation sequence: New lower low → support breakdown → resistance retest → bearish candle close → downward follow-through.
A brief move below support followed by a strong recovery would weaken the bearish interpretation. Understanding false breakouts and breakout traps helps distinguish temporary moves beyond a level from sustained directional breaks.
Gold’s weekly support reaction preserves a cautiously bullish outlook, but bearish daily structure and overhead resistance continue to limit confirmation.
For buyers, the key development is a break above the latest daily lower high and $4,175–$4,195, followed by a successful retest and bullish candlestick confirmation. That sequence would strengthen the outlook toward $4,265.
For sellers, the focus is a new lower low and a decisive breakdown below $4,000. A failed retest and bearish follow-through would bring $3,935 into focus.
Both price objectives remain conditional. Planning take-profit targets using market structure and risk-reward helps place these levels within a defined trading plan.
Until either confirmation sequence develops, gold remains in consolidation between weekly support and daily resistance.
Watch the levels. Wait for the retest. Let price confirm the direction.
_____________________________________________________________________________________
Move from learning price action to applying it in the real market.
Trade:
Access trading platforms and tools including ACY, MT4, MT5, and Copy Trading.
Create an Account and Start Live Trading
_____________________________________________________________________________________
Build your trading foundation with these step-by-step guides:
Learn to read price action and assess trading setups at key levels:
Learn to recognize bullish, bearish and sideways markets:
Learn to mark key levels and interpret price reactions:
Understand recurring price patterns, retests and false breakouts:
Learn to combine candlestick signals with price action analysis:
Learn to recognize patterns that may signal a change in market direction:
Explore how to combine the exponential moving average with price action:
Bring your technical analysis skills together through a gold swing trading guide:
Learn how risk management and position sizing fit into your trading plan:
Learn how to plan take-profit targets using market structure and risk-reward:
Develop discipline, emotional awareness and a more consistent trading process:
Explore the psychological habits behind a disciplined trading approach:
_____________________________________________________________________________________
Not sure where to begin? Here’s a simple roadmap to guide you:
By building step by step; from basics → real trading → mastering the craft, you’ll gain clarity, confidence, and steady progress without ever feeling overwhelmed.

_____________________________________________________________________________________
Follow Ruffy Grant B. Capacio for Gold analysis, Forex trading ideas, price action education, trading psychology, and market insights: LinkedIn
ACY Securities: Join the Discord Server
Disclaimer:
Trading Forex, Gold, CFDs, cryptocurrencies, commodities, indices, and other leveraged financial instruments involves a high degree of risk and may not be suitable for all investors or traders. Market conditions can change rapidly, and leveraged trading can result in losses that occur quickly.
Before trading, carefully consider your investment objectives, level of experience, and risk tolerance. Only trade with capital you can afford to lose and seek independent financial or professional advice where appropriate.
All market analysis, price forecasts, technical commentary, trading scenarios, educational materials, and opinions presented in this content are provided solely for general informational and educational purposes. They do not constitute financial advice, investment advice, a recommendation, solicitation, or an offer to buy or sell any financial instrument.
Past performance and historical price movements are not reliable indicators of future results. Any price levels, targets, scenarios, or market outlooks discussed should be viewed as analysis rather than guarantees of future market performance. October 21, 2026
ACY Securities is one of Australia's fastest growing multi-asset online trading providers, offering ultra-low-cost trading, rock-solid execution, technologically superior account management and premium market analysis.

Select the categories and companies you wish to follow directly to your person rss feed.
Create Custom RSS FeedSign up and join over 5,000 professional members who receive personalized news alerts, curated professional connections, and more for free!
FINMA has approved Switzerland’s first exchange-traded fund investing directly in Bitcoin, classed as an other alternative investment fund under Swiss law. The regulator cited investor protection and transparency, and warned that Bitcoin investments remain highly risky despite the approval. Others have applied.
Plus500 has conditionally agreed to acquire Guru, a regulated broker-dealer in Brazil, the second largest derivatives market globally. The deal builds on its Nelogica partnership and Colombian presence, and will be funded from existing cash of over $860m as of 30 June 2026. Closing is subject to regulatory approvals.
Market maker and technology provider iSAM Securities has integrated multi-asset liquidity provider Evenox into iSAM Securities Apex.
AUDCAD turns bearish after breaking key support and the 50 EMA. Watch 0.98455–0.98720 resistance for confirmation, with 0.98075 the downside target.
Gold (XAU/USD) holds weekly support as bulls eye $4,265. Explore key resistance at $4,175–$4,195, breakout signals and downside risk toward $3,935.
XTB has launched the largest advertising campaign in its history, bringing in former heavyweight world champion Tyson Fury to appear alongside its existing global ambassador, former Sweden international footballer Zlatan Ibrahimović.
DXtrade, the white-label trading platform from Devexperts, has launched a dedicated cryptocurrency interface for spot traders. It includes an exchange-style order book, flexible order sizing and trading from charts, and is available on web and mobile with broker branding options. Open APIs support integrations.
The Feed add-on provides a native community where providers can share updates, discuss market ideas, answer followers’ questions, and build trust directly inside Social Trading, while followers can read through that before they decide to subscribe.
Thunes and Coinbase have announced a strategic collaboration at Money20/20 USA. Coinbase will integrate Thunes’ Direct Global Network for payouts to local clearing systems, while Coinbase will power Thunes’ stablecoin infrastructure, supporting enterprise supplier payments, gig worker payouts and global remittances.
Hantec Group's prop firm brand Hantec Trader began operating as RZR Funded on 19 October.