
just now


Liquidity Finder Ltd is incorporated in England and Wales, company number 10610740, registered address 167-169 Great Portland Street, Fifth Floor, London W1W 5PF, United Kingdom.
Published: just now


The NAS100 price forecast favors a bearish outlook following a shift in weekly and daily market structure. Price has broken below weekly support, bringing the 29,800–30,400 zone into focus as potential resistance.
The weekly bearish candlestick reaction suggests selling pressure, while the daily chart shows price trading below the 50 EMA. Together, these signals support the downside scenario, although a confirmed resistance retest would provide stronger evidence of bearish continuation.
The next development to monitor is how price responds around 29,800–30,400. A bearish rejection could support a move toward 29,000, while a confirmed breakout and successful retest above the zone would strengthen a recovery toward 31,290.
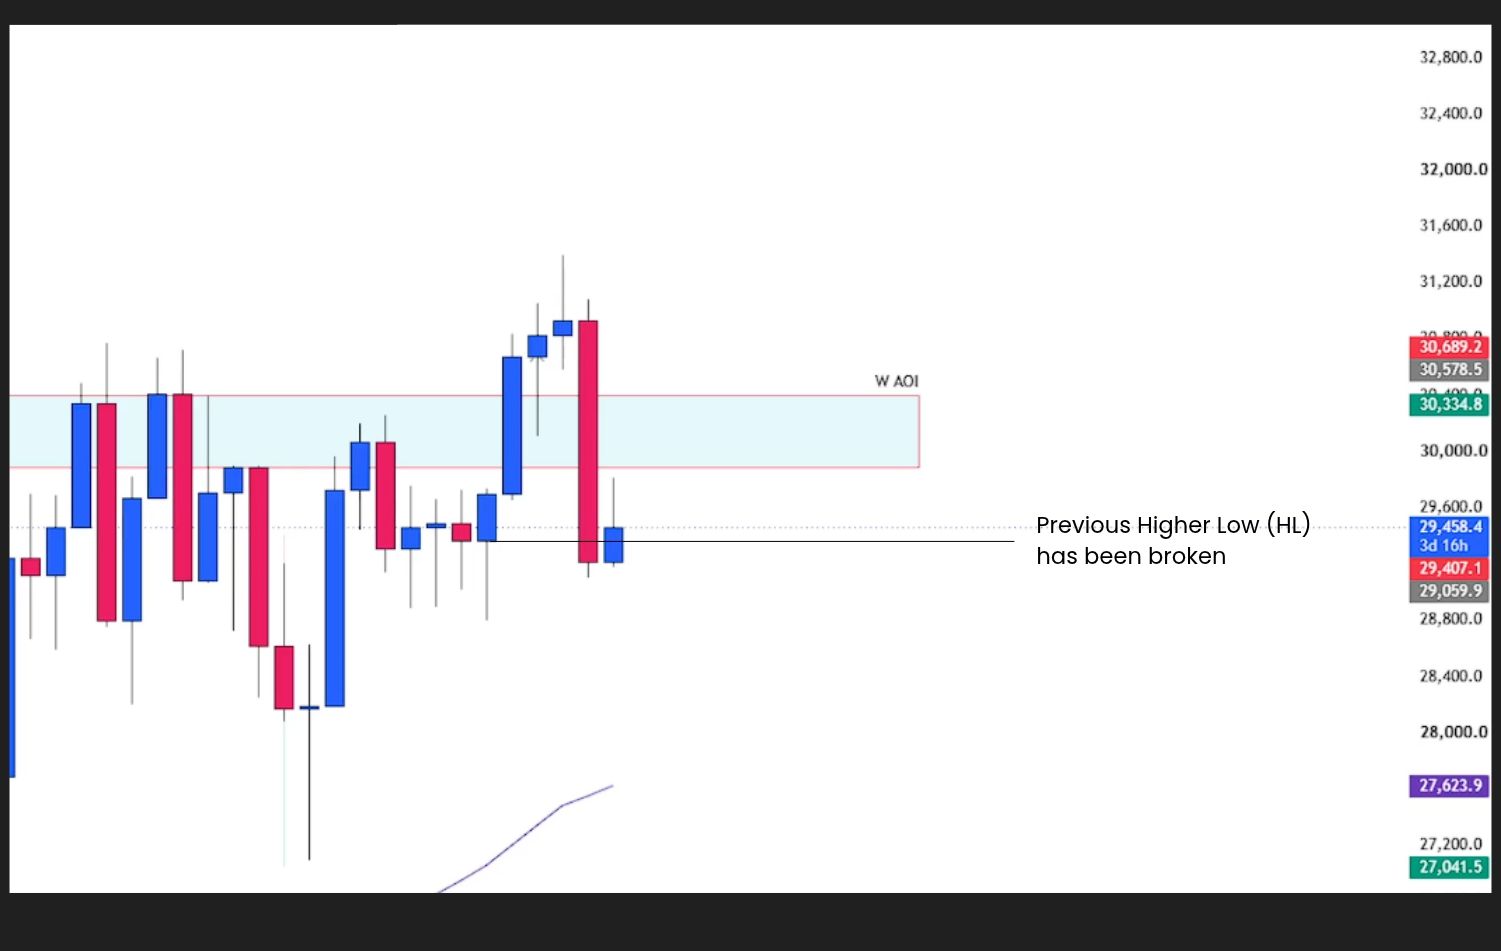
The weekly NAS100 chart shows a bearish structural shift following a break below an established support area.
The 29,800–30,400 zone now becomes an important test of seller control. When price breaks below support, a recovery toward that area can encounter selling pressure as former support begins acting as resistance.
Previous reactions around this weekly level reinforce its significance. However, historical respect for a zone does not guarantee that the next retest will hold.

Weekly Timeframe Price Action Analysis: Broken Support at 29,800–30,400 Becomes Potential Resistance.
The bearish candlestick reaction described on the weekly chart adds evidence of selling pressure. Its significance increases if the candle closes with a clear rejection and price subsequently moves lower.
Key weekly observations include:
If the weekly candle is still developing, its eventual close remains important. An early rejection can change before the week ends.
The daily chart supports the weekly bearish outlook, with price trading below the 50-period exponential moving average.
This positioning suggests weaker momentum, particularly when considered alongside bearish market structure. Trading below the moving average alone does not confirm that every subsequent move will be lower.

Daily Timeframe Price Action Analysis: Bearish Structure and Price Below the 50 EMA Support the Downside Bias.
During a recovery, the 50 EMA could provide an additional area of dynamic resistance. If it aligns with the weekly resistance zone when price retests, a bearish reaction there would add support to the continuation scenario.
The main confirmation remains price behavior: whether the recovery forms another lower high, produces a completed bearish rejection and follows through lower.
| Technical LevelSignificance |
| 29,800–30,400Former weekly support; potential resistance following the breakdown |
| 29,800Lower boundary of the weekly resistance zone |
| 30,400Upper boundary; a sustained reclaim would strengthen the bullish alternative |
| 29,000Potential downside target following confirmed bearish rejection |
| 31,290Conditional upside target following a bullish structural break and successful retest |
| Daily 50 EMATrend reference and potential additional resistance during a recovery |
| Relevant daily lower highStructural level buyers need to overcome to strengthen a reversal |
A move into the resistance zone would not independently confirm a bullish reversal. Buyers would need to reclaim the area and demonstrate that it can hold as support.

Daily Timeframe Price Action Analysis: Potential Bearish Continuation Following a Retest of Weekly Resistance.
The bearish scenario depends on sellers defending 29,800–30,400 during a proper retest.
A recovery toward this zone would allow traders to assess whether former support is becoming resistance. A completed bearish rejection candle or bearish engulfing pattern would provide evidence that sellers are responding.
The signal becomes stronger if price follows through below the confirmation candle’s low instead of immediately recovering into the zone.

Rejection at the daily 50 EMA could provide additional confirmation if the moving average is near the retest area.
A sustained recovery above 30,400, followed by a successful support retest, would weaken this bearish setup.
Confirmation sequence: Resistance retest → bearish candle close → downward follow-through → potential move toward 29,000.

Daily Timeframe Price Action Analysis: Conditional Bullish Recovery After a Structural Break and Resistance Reclaim.
The bullish alternative requires buyers to overcome the bearish structure and reclaim the broken weekly support zone.
The first structural requirement is a break above the relevant daily lower high. Buyers also need to establish price above 29,800–30,400, then defend the reclaimed area during a pullback.
A completed bullish rejection or bullish engulfing candle during the retest would suggest that buying interest is returning. Upward follow-through would strengthen the recovery scenario toward 31,290.

If the breakout fails and price falls back below the reclaimed zone, the bullish setup would weaken.
Confirmation sequence: Lower-high break and resistance reclaim → support retest → bullish candle close → upward follow-through.
The key question is whether 29,800–30,400 holds as resistance or is reclaimed as support.
Weekly and daily bearish structure, together with price below the daily 50 EMA, currently favor the downside scenario described in this analysis. A confirmed rejection at weekly resistance would strengthen the case for 29,000.
For the bullish alternative, buyers need to break the relevant lower high, reclaim the resistance zone and defend it during a retest. That sequence would bring 31,290 into focus.
Watch the retest. Wait for the candle close. Let price confirm the direction.
_____________________________________________________________________________________
Move from learning price action to applying it in the real market.
Trade:
Access trading platforms and tools including ACY, MT4, MT5, and Copy Trading.
Create an Account and Start Live Trading
_____________________________________________________________________________________
Build your trading foundation with these step-by-step guides:
Learn to read price action and assess trading setups at key levels:
Learn to recognize bullish, bearish and sideways markets:
Learn to mark key levels and interpret price reactions:
Understand recurring price patterns, retests and false breakouts:
Learn to combine candlestick signals with price action analysis:
Learn to recognize patterns that may signal a change in market direction:
Explore how to combine the exponential moving average with price action:
Bring your technical analysis skills together through a gold swing trading guide:
Learn how risk management and position sizing fit into your trading plan:
Learn how to plan take-profit targets using market structure and risk-reward:
Develop discipline, emotional awareness and a more consistent trading process:
Explore the psychological habits behind a disciplined trading approach:
_____________________________________________________________________________________
Not sure where to begin? Here’s a simple roadmap to guide you:
By building step by step; from basics → real trading → mastering the craft, you’ll gain clarity, confidence, and steady progress without ever feeling overwhelmed.

_____________________________________________________________________________________
Follow Ruffy Grant B. Capacio for Gold analysis, Forex trading ideas, price action education, trading psychology, and market insights: LinkedIn
ACY Securities: Join the Discord Server
Disclaimer:
Trading Forex, Gold, CFDs, cryptocurrencies, commodities, indices, and other leveraged financial instruments involves a high degree of risk and may not be suitable for all investors or traders. Market conditions can change rapidly, and leveraged trading can result in losses that occur quickly.
Before trading, carefully consider your investment objectives, level of experience, and risk tolerance. Only trade with capital you can afford to lose and seek independent financial or professional advice where appropriate.
All market analysis, price forecasts, technical commentary, trading scenarios, educational materials, and opinions presented in this content are provided solely for general informational and educational purposes. They do not constitute financial advice, investment advice, a recommendation, solicitation, or an offer to buy or sell any financial instrument.
Past performance and historical price movements are not reliable indicators of future results. Any price levels, targets, scenarios, or market outlooks discussed should be viewed as analysis rather than guarantees of future market performance. October 20, 2026
ACY Securities is one of Australia's fastest growing multi-asset online trading providers, offering ultra-low-cost trading, rock-solid execution, technologically superior account management and premium market analysis.

Select the categories and companies you wish to follow directly to your person rss feed.
Create Custom RSS FeedSign up and join over 5,000 professional members who receive personalized news alerts, curated professional connections, and more for free!
Challenge rules are a prop firm’s first line of defence – but only if they can be enforced. Straight from the dealing room, this guide shows how to write measurable rules, what a realistic funded-account rulebook looks like, how to catch network-level abuse early, and how Broktinger validates every payout against 45 checks.
MultiBank Group has announced the formation of a predominantly Emirati Board of Directors for MultiBank Exchange Holding, the first interbank trading platform in the BRICS and emerging countries, which achieved in October 2026 a turnover of over US$ 0.5 Trillion.
Monday saw a sharp rebound in Wall Street, with the Dow Jones rising 2.2%, the S&P 500 2.4%, and the Nasdaq 2.7%.
The Central Bank of Nigeria (CBN) has issued regulations that require issuers of foreign currency stablecoins used by Nigerians to incorporate locally.
Last week delivered the worst day for US technology stocks in six years. On Thursday, November 5, the Philadelphia Semiconductor Index fell 12%, its steepest daily drop since 2020, the Nasdaq Composite fell 5.5% into correction territory and the S&P 500 fell 4.3%. Micron and AMD each lost more than 17% in a single session. Then on Friday, the same stocks bounced, after a jobs report that came in at more than double expectations.
Toxic flow doesn’t only hit B-book brokers. In an STP model it shows up as wider spreads, more rejections and strained LP relationships. This guide explains what toxic flow really is, what it costs, the 35 patterns professional dealing desks monitor, and the practical steps to detect it and protect your brokerage.
The Monetary Authority of Singapore has launched a central bank gold vaulting service for foreign central banks, international financial institutions and sovereign entities, using a national vault that can hold up to 500 tonnes, and announced an enhanced GST framework for wholesale gold activities from April 2027.
24X Bermuda Limited has expanded its partnership with Standard Chartered to include digital assets prime brokerage, enabling Bitcoin and Ethereum trading on its multi-asset platform. Standard Chartered acts as central counterparty, with 24X running the execution-only platform for institutional crypto and FX products.
Learn how a demo trading account works, why beginners use it before live trading, and how to practice with virtual funds using a simple five-step guide.
Bitcoin faces resistance at $76,800–$80,800. Explore the BTCUSD bearish setup toward $71,000 and the bullish break-and-retest scenario targeting $86,500.