

Explore Companies BySectors & Categories
Explore Companies ByUse Cases
Explore Companies ByProducts & Services
Explore Companies ByRankings & Reviews
Featured NewsCompaniesMarketsCryptoTechRegulatoryCommentaryUKUSWorldMore

    Latest Wires

      Daily Newsletter

      LF Daily News

      Daily industry focused newsletter giving you an overview for the financial & finTech industry.

      See All Newsletters
      By clicking "Sign Up" you are agreeing to our Terms of Service and Privacy Policy

      Bullish and Bearish Pin Bar Candlestick: The Complete Guide to Trading Reversal Candlestick Confirmations

      Published: just now

      Bullish and Bearish Pin Bar Candlestick: The Complete Guide to Trading Reversal Candlestick Confirmations

      Post illustration


      One of the most reliable Japanese candlestick patterns in price action trading is the Pin Bar. Professional traders use this pattern to identify potential market reversals, reject key support and resistance levels, and confirm high-probability trade setups.


      However, many beginner traders make the mistake of trading every pin bar they see. In reality, a pin bar is only powerful when it appears in the right market context.


      In this guide, you'll learn:

      1. What a bullish pin bar is
      2. What a bearish pin bar is
      3. Why pin bars work
      4. How professional traders use them
      5. Common mistakes to avoid

      _____________________________________________________________________________________
      Want to learn more about candlesticks confirmations?


      Master candlestick patterns and price action trading with these essential guides every trader should know:

      1. The Top Japanese Candlestick Patterns to Trade: Mastering Japanese Candlestick Confirmation + Pairing with Price Action Analysis
      2. The Top Japanese Candlestick Patterns to Trade: How to Use the Engulfing Candlestick as a High-Probability Entry Signal

      ______________________________________________________________________________________


      What is a Pin Bar candlestick?


      Post illustration


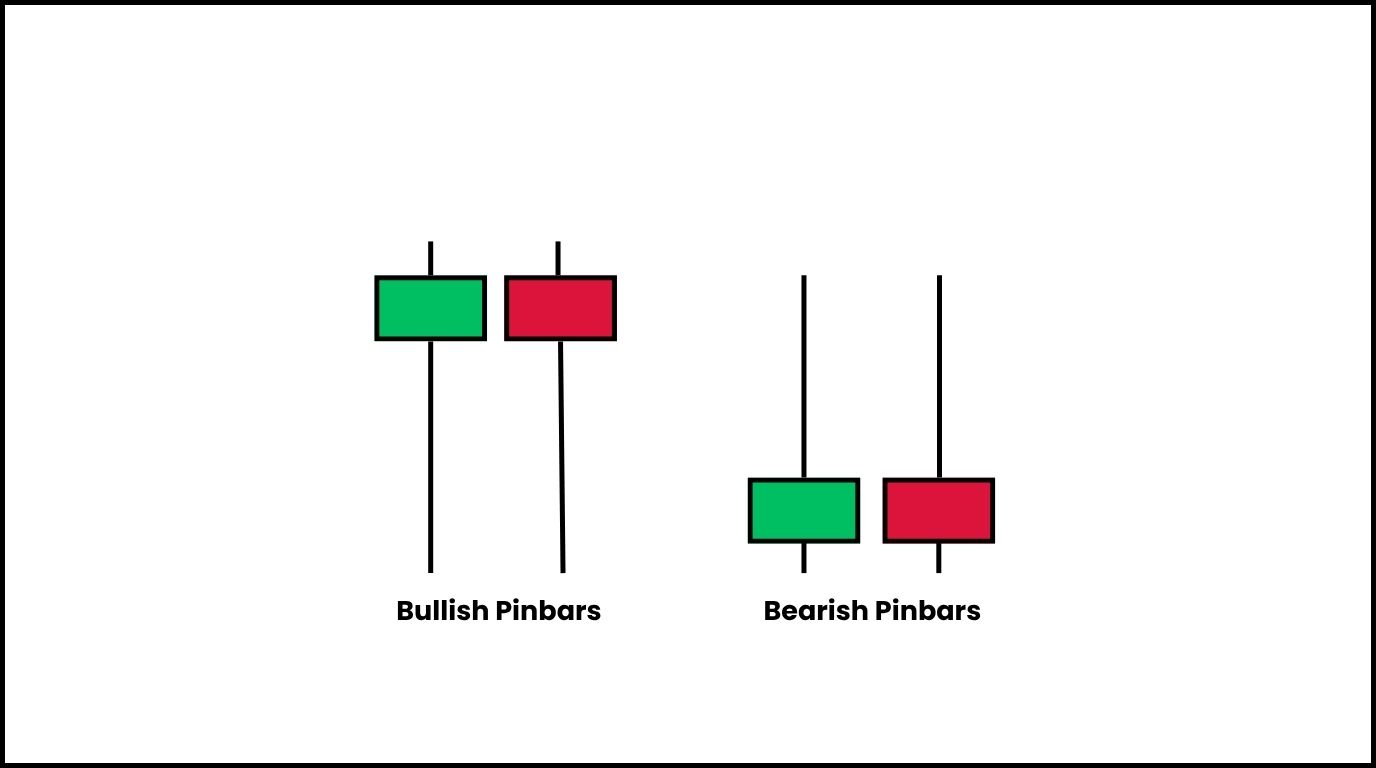
      A Pin Bar (Pinocchio Bar) is a candlestick with:

      1. A long wick (tail)
      2. A small real body
      3. Very little or no wick on the opposite side


      The long wick represents a strong rejection of price.

      Instead of continuing in one direction, buyers or sellers completely rejected the move before the candle closed.


      This rejection often signals that momentum is shifting.

      Bullish Pin Bar (Hammer)


      Post illustration


      Reversal Candlestick Confirmation. Bullish Pin Bar (Hammer) Candlesticks

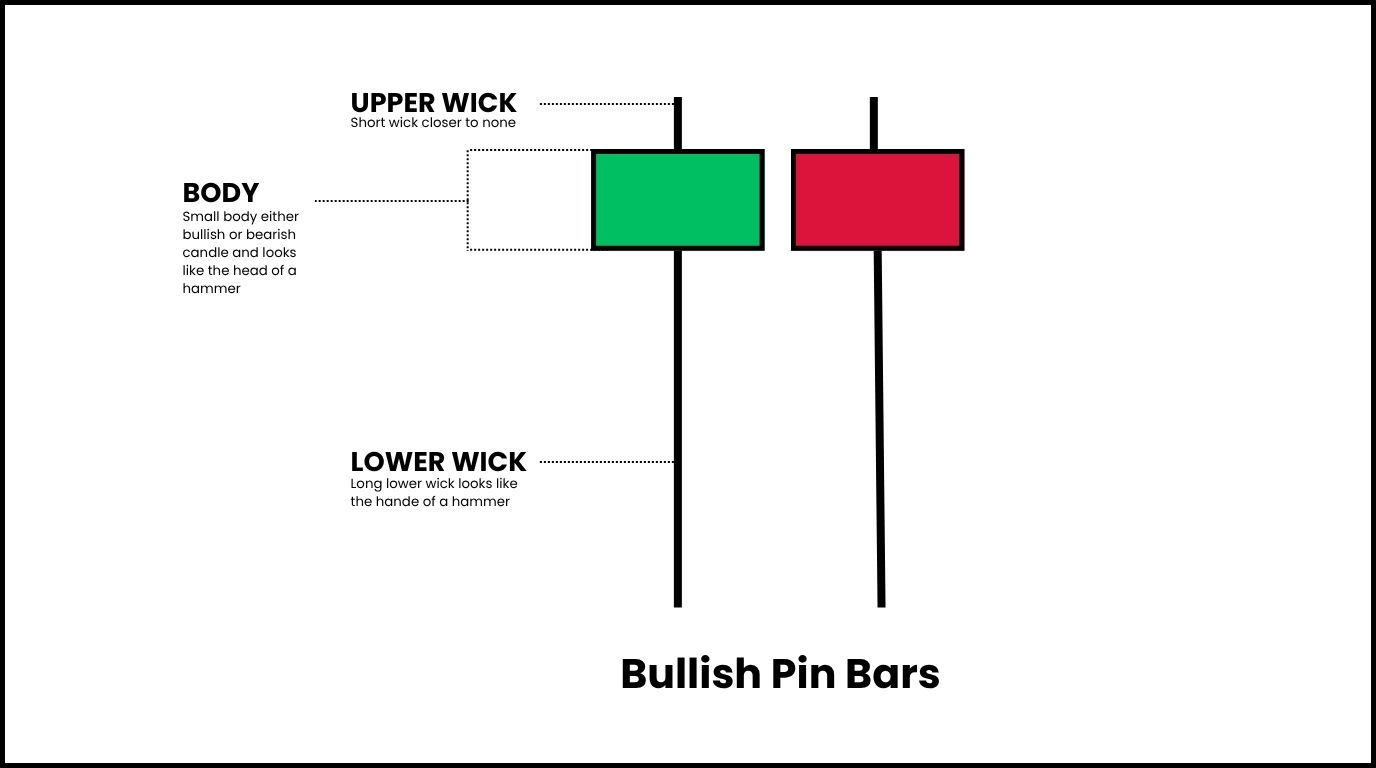
      A bullish pin bar forms after sellers push price lower but buyers regain control and force the candle to close back near the top (highs).


      Basic form:

      1. Looks like a hammer

      Post illustration

      Bullish Pin Bar Candlestick Confirmation


      Characteristics:

      1. Long lower wick
      2. Small body (bullish or bearish body) at the top
      3. Little or no upper wick

      Post illustration

      Bullish Pin Bar Candlestick Confirmation Signals Bullish Push (Upside Push)


      Bullish Pin Bar signals:

      1. Strong buying pressure
      2. Rejection of lower prices (rejections at lows structures)
      3. Possible bullish reversal (upside push)


      What is the context behind the bullish pin bar, and why it works?


      The long lower wick shows sellers attempted to push price lower but failed.


      Buyers absorbed the selling pressure and finished the candle near the highs.


      This often indicates demand entering the market.
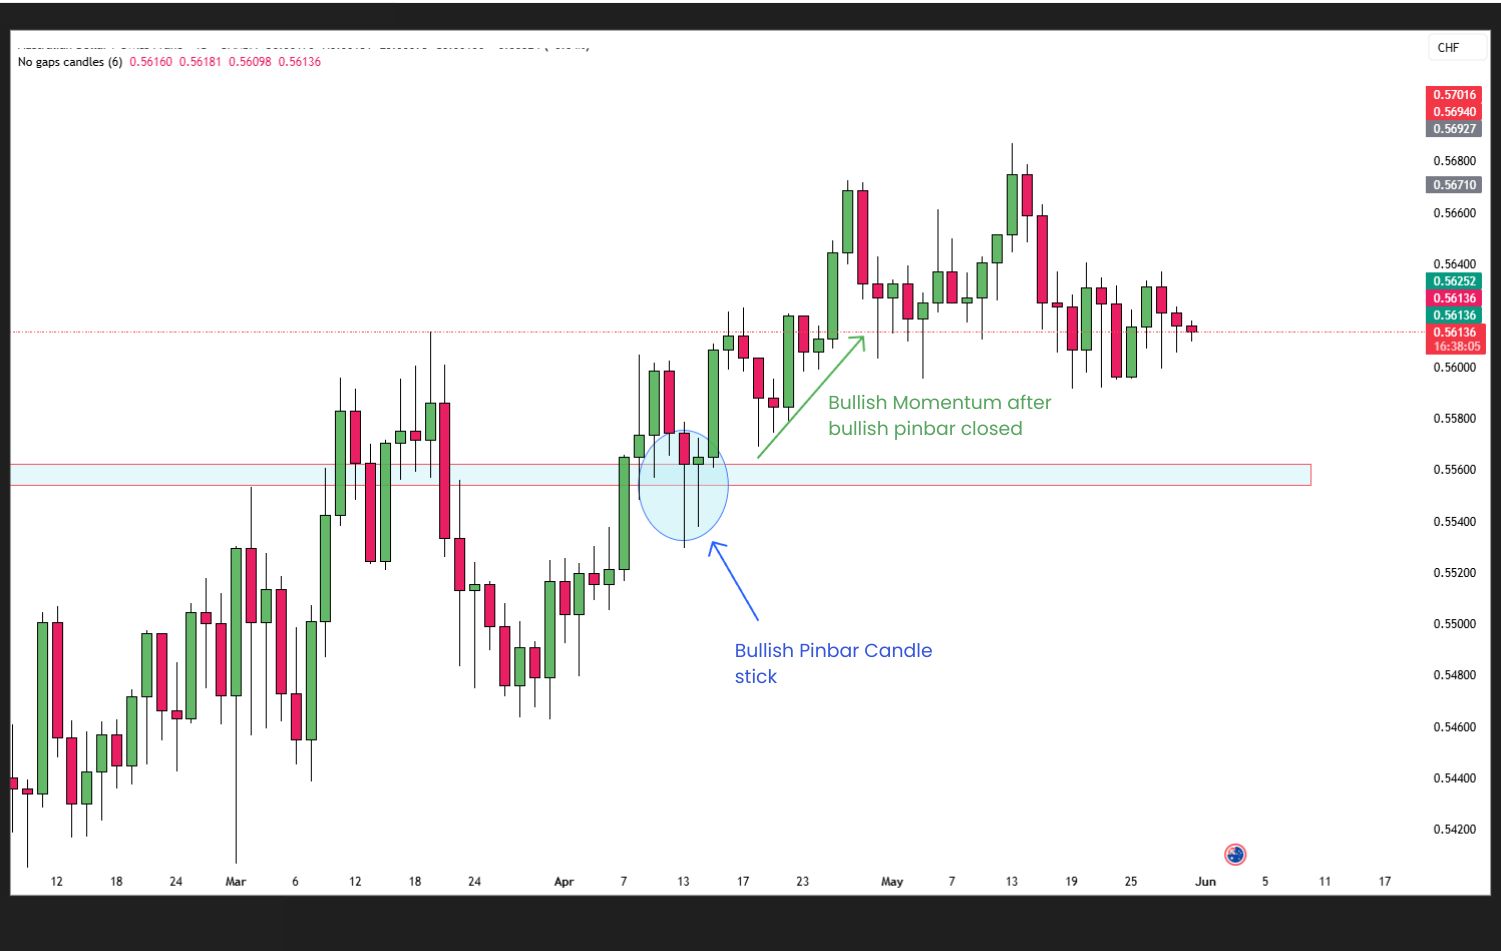

      What is the high-probability bullish Pin Bar setup?


      Post illustration

      Bullish Pin Bari Confirmation Setup with High-Probability Confluences


      Professional traders look for bullish pin bars that form at:

      1. Major weekly or daily support levels
      2. Potential higher lows (HL)
      3. Potential lower lows (LL)
      4. Break-and-retest setups
      5. Uptrend pullbacks
      6. Retest reversal patterns


      The more technical factors supporting the rejection, the stronger the setup.

      Take note:

      Past performance is not a reliable indicator of future results.

      Bearish Pin Bar


      Post illustration

      Reversal Candlestick Confirmation. Bearish Pin Bar (Inverse Hammer) Candlesticks


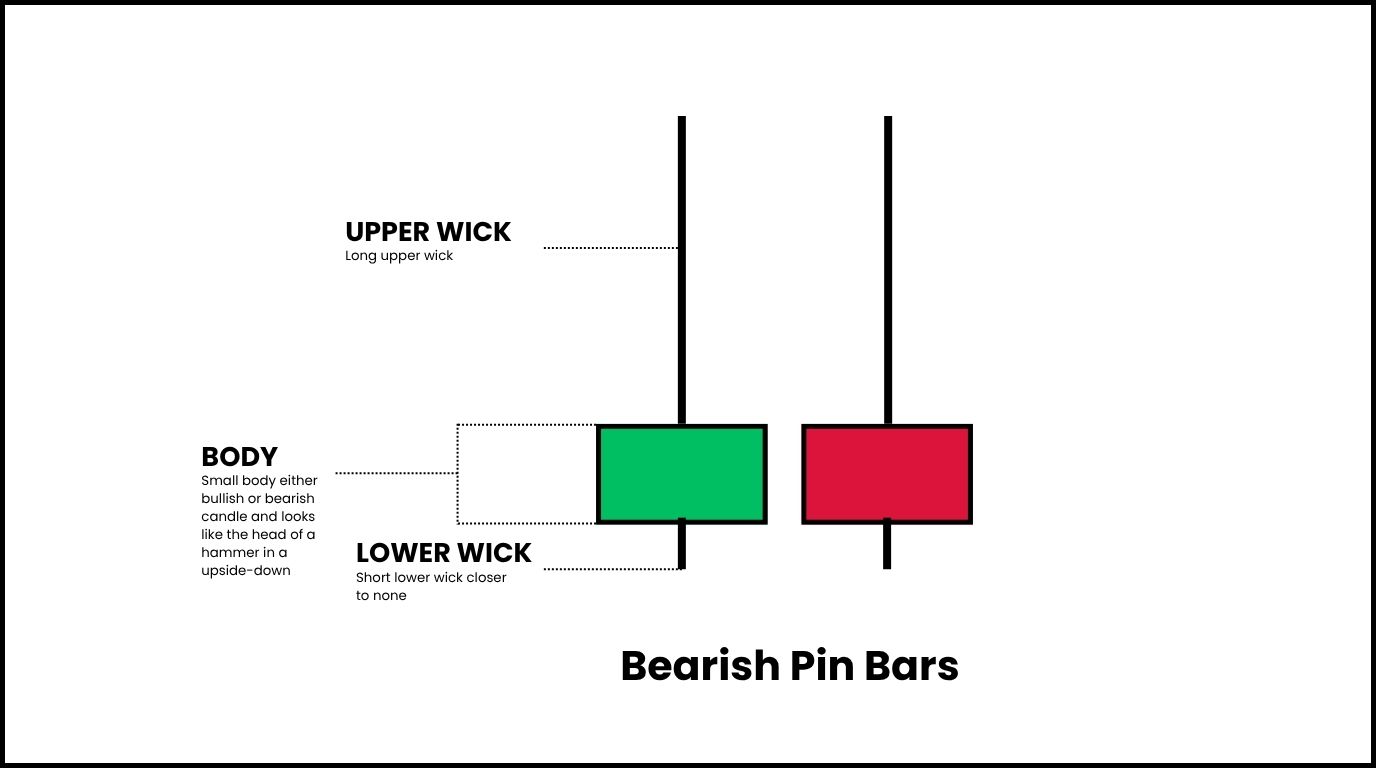
      A bearish pin bar forms after buyers push price higher but sellers completely reject the move.


      Basic form:

      1. Looks like an upside-down hammer

      Post illustration

      Bearish Pin Bar Candlestick Confirmation


      Characteristics:

      1. Long upper wick
      2. Small body near the bottom
      3. Little or no lower wick

      Post illustration

      Bearish Pin Bar Candlestick Confirmation Signals Bearish Push (Downside Push)


      Bearish Pin Bar signals:

      1. Strong selling pressure
      2. Rejection of higher prices (rejections at highs structures)
      3. Possible bearish reversal (downside push)


      What is the context behind the bearish pin bar, and why it works?


      The long upper wick shows buyers initially controlled the session.


      However, sellers overwhelmed the buying pressure and forced price back down before the candle closed.


      This often signals that institutions are defending resistance.
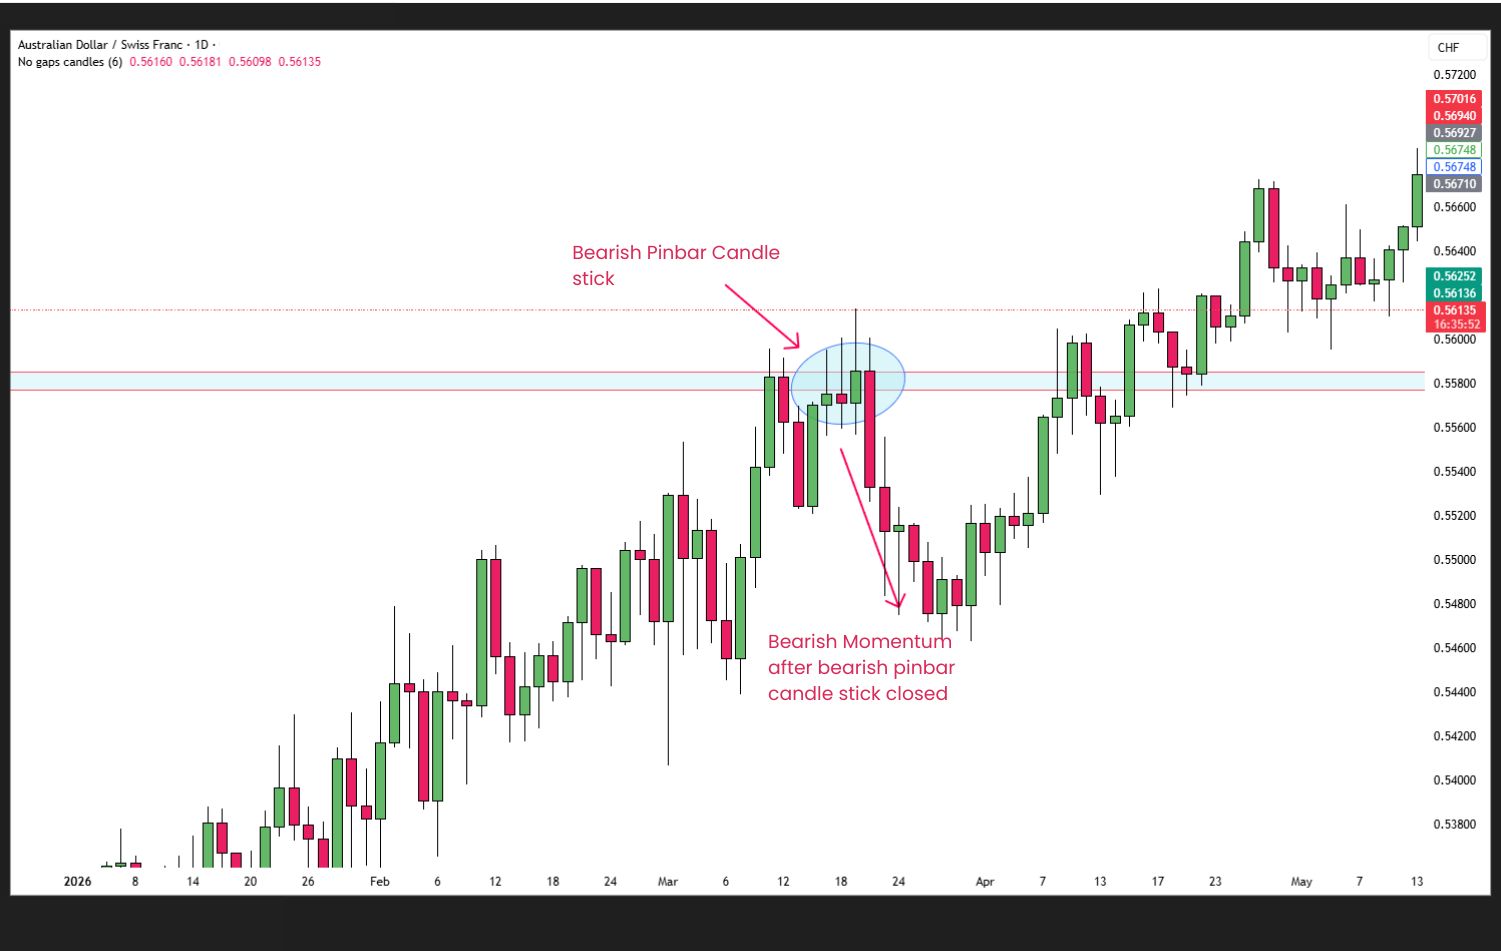

      What is the high-probability bearish Pin Bar setup?


      Post illustration

      Bearish Pin Bari Confirmation Setup with High-Probability Confluences


      The best bearish pin bars appear around:

      1. Major weekly or daily resistance levels
      2. Potential lower highs (LH)
      3. Potentials higher highs (HH)
      4. Break-and-retest resistance
      5. Downtrend pullbacks
      6. Retest reversal patterns

      Take note:

      Past performance is not a reliable indicator of future results.


      Why the context matters more the confirmation?


      Post illustration


      A pin bar by itself is not a trading signal.

      Its probability increases dramatically when it aligns with the overall market structure.


      Ask yourself:

      1. Is the higher timeframe bullish or bearish?
      2. Is price reacting at a key support or resistance level?
      3. Has market structure shifted?
      4. Is there a break-and-retest setup?
      5. Does the 50 EMA support the trend?


      Golden nugget:

      The more confirmations you have, the higher the probability of the trade that you can execute.

      ______________________________________________________________________________________

      Want to master in combining Pin Bars with price action confluences for high-probability trades?


      Learn how professional traders combine candlestick patterns, market structure, support and resistance, and price action confirmations with these essential guides:

      1. How to Step-by-Step Swing Trade with Pure Technical Price Action Analysis?
      2. A Guide to Master a Price Action Strategy That Works in Any Market: Complete Guide on How to Trade with Market Structure + Support & Resistance (Step-by-Step)
      3. The Top Japanese Candlestick Patterns to Trade: Mastering Japanese Candlestick Confirmation + Pairing with Price Action Analysis
      4. The Top Japanese Candlestick Patterns to Trade: How to Use the Engulfing Candlestick as a High-Probability Entry Signal
      5. Master Exponential Moving Average: How to Trade using EMA Indicator with Price Action Analysis?
      6. Reversal Chart Patterns: The Complete Guide to Spotting Bullish and Bearish Trend Reversal Pattern in Trading

      ______________________________________________________________________________________

      What are the common mistakes in trading Pin bars?


      Post illustration


      Avoiding these common pin bar trading mistakes can help you identify higher-probability setups.

      Common mistakesWhy it's a problemBest practice
      Trading every pin barNot every pin bar leads to a reversal. Always consider the surrounding market structure.Trade only at key support or resistance.
      Ignoring the trendA bullish pin bar against a strong downtrend has a lower probability than one that aligns with the prevailing trend.Trade with the overall trend.
      Ignoring support and resistanceA pin bar in the middle of a trading range carries less significance than one forming at a major support or resistance level.Focus on major support and resistance levels.
      Entering too earlyWait for the candle to close before making a trading decision. A forming pin bar can change significantly before the session ends.Wait for the pin bar to close before entering.

      Pin Bar cheat sheet


      Use this bullish and bearish pin bar cheat sheet to quickly identify pin bar candlestick patterns, understand reversal signals, and improve your price action trading with high-probability trade setups.

      FeatureBullish Pin Bar Bullish Pin Bar
      SignalPotential bullish reversalPotential bearish reversal
      ShapeLong lower wick, small body at the topLong upper wick, small body at the bottom
      Basic FormLook like a hammerLook like a upside down hammer
      PsychologyBuyers reject lower pricesSellers reject higher prices
      Best LocationSupport, demand zone, swing lowResistance, supply zone, swing high
      TrendUptrend or pullback to supportDowntrend or pullback to resistance
      ConfirmationBullish market structure + rejection + 50 EMABearish market structure + rejection + 50 EMA
      EntryAfter candle closes with bullish confirmationAfter candle closes with bearish confirmation
      Stop LossBelow the pin bar lowAbove the pin bar high
      TargetNext resistance or swing highNext support or swing low
      AvoidTrading against the trend or away from supportTrading against the trend or away from resistance

      Final thoughts


      Post illustration


      The pin bar is one of the most effective reversal candlestick patterns, but it's true power lies in the context in which it forms.


      Professional traders don't rely on the pattern alone. They combine it with trend direction, support and resistance, market structure, and confirmation from higher timeframes to identify high-probability trade opportunities.


      Always remember:

      By waiting for the right conditions instead of reacting to every pin bar, you can improve your consistency and make more disciplined trading decisions.

      _____________________________________________________________________________________

      FAQs


      Is a pin bar a reversal pattern?

      Yes. A pin bar is a reversal confirmation, especially at key support or resistance levels.

      Is a bullish pin bar always a buy signal?

      No. Always confirm it with trend, market structure, and price action.

      What timeframe works best for pin bar trading?

      The 4-hour, daily, daily, and weekly timeframes provide the most reliable signals.

      Can pin bars be used in Forex, stocks, crypto, and indices?

      Yes. Pin bars work in all liquid financial markets.

      What is the biggest mistake traders make with pin bars?

      Trading every pin bar without considering trend, support/resistance, and market context.

      _____________________________________________________________________________________

      Your next step is:

      1. To know trader’s beginner steps before your trade
      2. Mastering your psychology
      3. Mastering the simple price action strategy
      4. Mastering Repetitive Patterns in Trading
      5. Trading live using this simple price action strategy


      For more in-depth market breakdowns, real-time analysis, and structured learning content, you can join our Discord community inside ACY Server:

      Discord Server - ACY Securities Server


      Start your live trading journey today!

      • Trade Forex, indices, gold, crypto and other global markets

      • Access powerful platforms including ACY, MT4, MT5, and Copy Trading tools


      Move from learning simple price action to executing it in the real market with confidence!


      Create an Account. Start Your Live Trading Now!


      Check out my contents:

      Beginners path

      Build a strong trading foundation with step-by-step lessons designed for beginners:

      1. Beginner Trading Steps: 4 Rules to Follow Before You Trade
      2. Beginner Trading Steps: Mistakes That Can Slow Down Your Progress (And How to Avoid Them)
      3. The 1% Risk Rule: The Most Common Mistakes That Quietly Destroys 90% of Traders
      4. Habits of a Successful Traders: What are the 4 Ways to Build Discipline in Trading?
      5. Beginner Trading Guide: The Complete Beginner's Roadmap to Smarter Trading (Step-by-Step)
      6. A Complete Beginner's Guide: What are the Only Technical Trading System You Need to Trade Gold, Forex, Crypto, Commodities & Indices?

      Mastering popular forex pairs using simple price action strategy

      Ready to learn simple price action strategy? Here’s how to do it step by step:

      1. USD/JPY Analysis Today: Simple Trades, Clear Moves, for Beginners Using Price Action
      2. Simple Day Trade Price Action On EUR/USD: Why the Drop to 1.14190?
      3. Simple Price Action Analysis on EUR/CAD: EURCAD the Pair for the Week?
      4. Simple Price Action Strategy on USD/ CHF: 0.80000 the Key Ceiling for USD/CHF Sell?
      5. Price Action Analysis for GBPCAD Trade: A Potential Trade for This Week or Next Week?
      6. EUR/GBP Trading Guide: How to Spot High-Probability Setup a Week Ahead Using Simple Price Action Strategy?
      7. Simple Price Action Trade on CAD/JPY: 115.000 the Key Floor for CAD/JPY Buy?
      8. USD/JPY Price Action Outlook: Is 158.500 the Key Floor for a Potential New High?
      9. CAD/JPY Price Action Breakdown: We Anticipated the Move Twice to 116.500, Is Price Action Really the King?
      10. GBP/NZD Trade Ideas Using Simple Price Action Strategy: Will Price Drops to 2.28000?
      11. USD/JPY Technical Forecast: 158.500 Floor Retest for Preparing for New Highs?
      12. GBP/CHF Price Action Ideas: Is 1.05500 the Ceiling for a New Low?
      13. GBP/CAD Simple Forex Price Action Ideas: Is the 1.84500 Support Level Holding?
      14. AUD/USD Simple Price Action Forecast: Why Buy at 0.71700 Support Area?
      15. GBP/NZD Price Action Idea: Is GPB/NZD 2.3000 Key Floor for Bullish Continuation?
      16. GBP/USD Price Action: Trade Setups on a Ranging Market?
      17. USD/CAD Simple Price Action: Is 1.36500 the Key Bullish Floor?
      18. USD/CAD Price Action Ideas: Setting Up for the Next Bullish Push?
      19. EUR/JPY Price Action: Is It Retesting a Reversal Pattern?
      20. NZD/USD Forecast: Potential Consolidation Breakout on NZD/USD?
      21. AUD/JPY Price Action Forecast: Is AUD/JPY Setting Up for a Massive Sell?
      22. NZD/USD Price Action Forecast: Is a Reverse Double Top Pattern Forming?
      23. NZD/USD Price Action Forecast: Is a Reverse Double Top Pattern Forming?
      24. AUD/CHF Forex Price Action Idea: Are Sellers Defending the 0.56504–0.56200 Key Level?
      25. AUD/CHF Price Action Forecast: Price Breaks Below Consolidation, What's Next?
      26. EUR/USD Forecast Today: Can NFP News Today Push EUR/USD Down to 1.13000?
      27. EURCHF Price Action Forecast: Is a Bearish Double Top Signaling a Major Drop?
      28. EUR/USD Price Action Forecast Today: Will the 1.14150–1.14520 Resistance Trigger a Drop to 1.13500?
      29. EUR/USD Price Action Forecast Update Today: Is the 1.1410 – 1.4520 Resistance Level Still Potentially Trigger a Drop?
      30. GBP/AUD Price Action Forecast Today: Will the British Pound or Australian Dollar Come Out on Top?
      31. GBP USD Price Action Forecast Today: Will the Sellers Hold the Resistance? or Will the Buyers Push the Price Higher?

      Master how to identify market trend

      Learn how to identify bullish, bearish, and sideways markets using price action to make more informed trading decisions:

      1. A Guide to Master Price Action Strategy that Works in Any Market: How to Master the Trend in Trading Any Market
      2. A Guide to Master a Strategy that Works in any Market: The Structure of a Market Trend
      3. A Guide to Master a Price Action Strategy That Works in Any Market: Complete Guide on How to Trade with Market Structure + Support & Resistance (Step-by-Step)

      Learn of how to identify support and resistance

      1. A Guide to Master a Strategy that Works in Any Market: How to Identify Support and Resistance Levels?
      2. A Guide to Master a Price Action Strategy That Works in Any Market: Complete Guide on How to Trade with Market Structure + Support & Resistance (Step-by-Step)

      Master how to use break & retest pattern

      Ready to learn and capitalize the repetitive patterns in the markets? Here’s how to do it step by step:

      1. Break and Retest: A Simple Repetitive Price Action Pattern?
      2. Break and Retest: How to Capitalize Repetitive Patterns in Trading?
      3. EUR/JPY Price Action: Is It Retesting a Reversal Pattern?
      4. False Breakouts: How to Avoid Breakout Traps and Trade Smarter?

      Master how to use candlestick confirmation & patterns

      Discover how candlestick patterns can help confirm market direction:

      1. The Top Japanese Candlestick Patterns to Trade: Mastering Japanese Candlestick Confirmation + Pairing with Price Action Analysis
      2. The Top Japanese Candlestick Patterns to Trade: How to Use the Engulfing Candlestick as a High-Probability Entry Signal

      Master the art of trading trend reversal patterns

      1. Reversal Chart Patterns: The Complete Guide to Spotting Bullish and Bearish Trend Reversal Pattern in Trading

      Mastering the 50 EMA

      1. Master Exponential Moving Average: How to Trade using EMA Indicator with Price Action Analysis?

      Learn how to trade Gold

      Gold is still one of the most traded assets, here’s how to trade it with confidence:

      1. XAUUSD Price Action: A Beginner Buy Setup for Next Week
      2. How to Trade Gold Using Simple Price Action Outlook: 4500 the Key Zone for XAUUSD Buys?
      3. The Simplest Way to Trade XAU/USD Using Price Action Analysis: Buy and Sell Anticipation on Gold?
      4. XAU/USD Price Action: Will Gold Rally to $4,900 Today?
      5. Gold (XAU/USD) Price Action Forecast: Will XAU/USD Drop to $4650?
      6. Gold (XAU/USD) Trade Ideas: A Simple Price Action Analysis on Gold This Week?
      7. Gold (XAU/USD) Price Action Idea: A High-Probability Trade Setup on Gold?
      8. Gold XAU/USD Price Action Idea: Is a Bullish Momentum Coming?
      9. Gold (XAU/USD) Price Action Ideas: Will News Trigger a Breakout or Consolidation on Gold?
      10. How to Step-by-Step Swing Trade Gold (XAU/USD) with Pure Technical Price Action Analysis?
      11. Gold XAU/USD Price Action Forecast: Anticipating a Consolidation Breakout on Gold Again?
      12. Gold XAU/USD Price Action News Forecast Today: Can XAU/USD Break Above the $4,200–$4,190 Resistance Zone or Hold?
      13. Gold XAU/USD Forecast Update Today: How the $4,200–$4,190 Resistance Zone Triggered the Selloff?
      14. Gold (XAU/USD) Price Action Forecast Update Today: Is the Double Top Pattern Signaling Another Gold Selloff?
      15. Gold (XAU/USD) Price Action Forecast Update Today: Did the Double Top Pattern Trigger the Massive Selloff?
      16. Gold (XAU/USD) Price Action Forecast Update Today: Could Gold Price Still Drop to $3,930?

      Swing trading 101

      1. How to Step-by-Step Swing Trade Gold (XAU/USD) with Pure Technical Price Action Analysis?

      Learn how to trade crypto with price action strategy

      1. Bitcoin BTC/USD Price Action: Could Bitcoin Still Keep Dropping?
      2. Bitcoin (BTC/USD) Price Action Insight: Could Bitcoin Still Drop to $58,000?
      3. Bitcoin (BTC/USD) Forecast Update: Has the $58,000 Correction Ended?
      4. BTC USD Price Action Forecast Today: Is the $66,070 – $65,470 Resistance the Key to Bitcoin's Next Move?

      Mastering trader's mindset

      Your mindset is what separates steady growth from costly mistakes. Focus on these essentials:

      1. Trading Mindset: Why Trading Exposes Who You Really Are?
      2. Consistency in Trading is Key: Why Discipline Beats Intelligence?
      3. Overtrading: Why More Trades Do Not Mean More Profits?
      4. Trading Wick Outs: How to Handle Fake Outs and Market Losses?
      5. Trading Psychology: The Truth About Trading Success
      6. Deliberate Practice in Trading: Why Intentional Practice Beats More Screen Time?
      7. Trading Psychology: Why Most Traders Struggle With Consistency? (And It Has Nothing to Do With the Market)

      Professional trader's mindset masterclass

      Develop the mindset of a professional trader by mastering discipline, emotional control, patience, and consistency to achieve long-term trading success:

      1. Trading Psychology: Why the Mindset of a Profitable Traders Separates from Everyone Else?
      2. The Professional Trader's Mindset: 6 Psychological Traits Every Consistently Profitable Trader Needs

      Risk management series

      Learn the essential risk management strategies to protect your capital, manage losses, and trade with confidence:

      1. Risk Management in Trading: What Is the Secret to Long-Term Trading Success?

      Beginner trading roadmap

      Not sure where to begin? Here’s a simple roadmap to guide you:

      1. Common beginner Traders Mistakes → avoid overtrading, revenge trading, and chasing the market.
      2. Master Traders Psychology → build discipline, patience, and emotional control
      3. Mastering Risk Management → learn how to have a sustainable trading.
      4. Master Simple Technical strategies & Indicators → especially price action, key levels, and market structure.
      5. Applying to Real Market → forex, crypto and indices.


      By building step by step; from basicsreal tradingmastering the craft, you’ll gain clarity, confidence, and steady progress without ever feeling overwhelmed.


      Follow me for more daily market and educational insights!

      Ruffy Grant B. Capacio - LinkedIn | Telegram | YouTube

      Acy Securities - Discord


      Disclaimer:

      Trading forex and derivative instruments involves substantial risk and may not be suitable for all individuals. Only use funds that you are prepared to lose. It is important to understand how these markets work and the risks involved before trading, and to seek independent financial advice if needed. All market analysis and insights shared are intended for educational and informational purposes only and should not be considered financial or investment advice. July 28, 2026

      ACY Securities is one of Australia's fastest growing multi-asset online trading providers, offering ultra-low-cost trading, rock-solid execution, technologically superior account management and premium market analysis.

      This content may have been written by a third party. LiquidityFinder makes no representation or warranty and assumes no liability as to the accuracy or completeness of the information provided, nor any loss arising from any investment based on a recommendation, forecast or other information supplies by any third-party. This content is information only, and does not constitute financial, investment or other advice on which you can rely.
      Comments
      Most Recent
      Written By
      Daily Newsletter

      LF Daily News

      Daily industry focused newsletter giving you an overview for the financial & finTech industry.

      See All Newsletters
      By clicking "Sign Up" you are agreeing to our Terms of Service and Privacy Policy
      RSS Feeds

      Create a custom RSS Feed

      Select the categories and companies you wish to follow directly to your person rss feed.

      Create Custom RSS Feed

      Related Categories:

      Related Tags:

      #ProviderNews#TradingPlatform#MarketNews#FinTech

      Related Articles:

      Find The Right Partners for
      Your Trading Business

      Sign up and join over 5,000 professional members who receive personalized news alerts, curated professional connections, and more for free!

      Create Your FREE Account
      Get access to latest news, updates, real-time data, brokerage and trading firm insights and customized information feeds.

      Bybit has launched Perp Options, described as the first options contracts built on TradFi perpetuals, giving traders round-the-clock access to US equity options. SpaceX and Nvidia are the first underlying assets, with USDT settlement and integration into Bybit's Unified Trading Account.

      just now

      Use this trading preparation checklist to plan your session, define entry rules, manage risk, and build a disciplined trading routine in seven steps.

      just now

      Your Bourse expands its crypto liquidity ecosystem with Caladan, giving brokers access to broader market coverage, institutional execution capacity and streamlined settlement.

      just now

      Scope Markets, the retail brokerage part of Rostro Group, has appointed Ibrahim Hossny as Head of Research and Marketing for the Middle East and North Africa.

      just now

      Hantec Prime, the institutional division of Hantec Markets, has reported trading volume up more than 300% year-to-date, alongside the addition of 42 new institutional clients since December, capping one of its strongest years of growth to date.

      just now

      Learn how to refine XAUUSD support and resistance on the daily chart using candle bodies, market structure and weekly gold levels for swing trading. A slug alone cannot guarantee a top Google ranking. Keep it focused rather than adding every supporting keyword.

      just now

      The week in Dubai will be focused on connecting directly with the industry and discussing how technology can help modern brokerages simplify operations, automate workflows, strengthen operational control, and scale efficiently.

      just now

      Devexperts has launched a turnkey solution giving brokers in South Korea access to US equity markets, combining its DXtrade trading platform, dxFeed market data, and execution services. The offering targets South Korea's growing retail demand for US stocks, worth several billion USD monthly.

      just now

      Assess why WTI crude oil surged past $105 per barrel amid Saudi pipeline disruptions, record tanker charter rates, and escalating geopolitical tensions.

      just now

      Bitcoin price forecast: BTC/USD retests $78,460–$80,215 resistance. Watch bearish confirmation toward $72,480 or a bullish breakout toward $86,150.


      just now
      Feed