just now
Liquidity Finder Ltd is incorporated in England and Wales, company number 10610740, registered address 167-169 Great Portland Street, Fifth Floor, London W1W 5PF, United Kingdom.
Published: just now

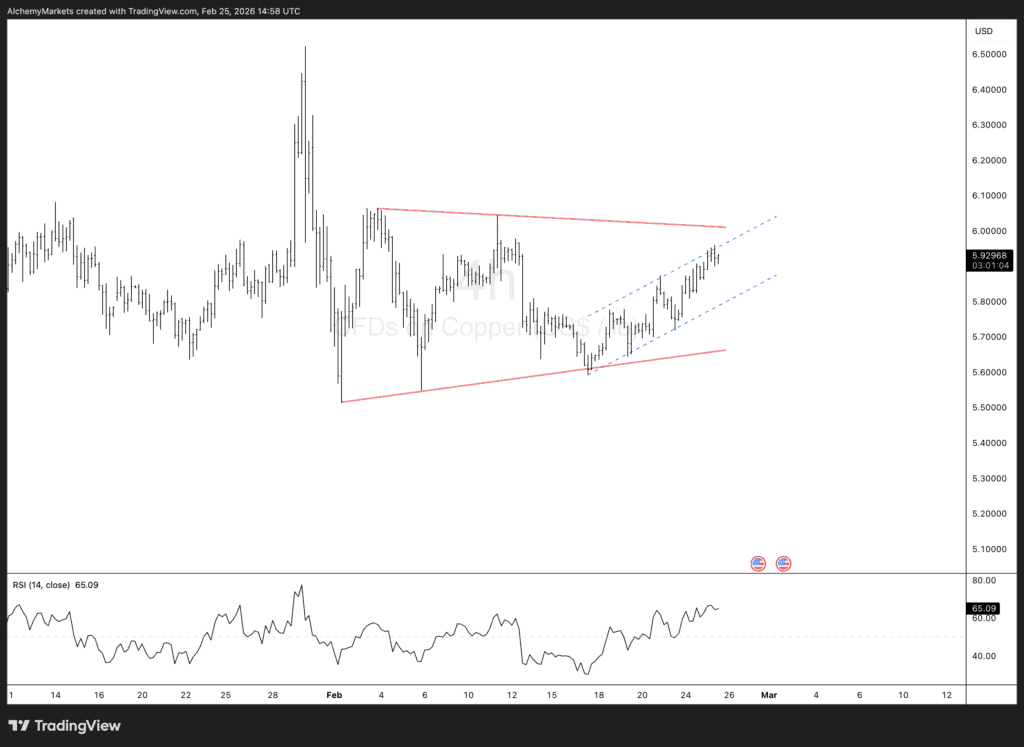
Today’s Copper Chart of the Day highlights a market at inflection. After the sharp January–early February impulse, copper has transitioned from expansion to compression. Price is now pressing into the upper boundary of a medium-term triangle — but the internal structure suggests this move may be corrective rather than impulsive.
The dominant leg on the chart remains the January impulse higher. It was fast, aggressive, and momentum-driven. Wide-range candles, strong follow-through, and volatility expansion defined that phase.
Since then, price hasn’t extended meaningfully higher.
Instead, we’ve seen overlapping candles and narrowing price swings — classic consolidation behavior.
Structurally, that rally still controls the broader narrative. It represents the last clear expansion phase. Everything afterward has been digestion.
When markets digest strong impulses, they typically:
That’s exactly what copper is doing now.
Volatility has contracted. Swings are tightening. Highs are capped lower while lows creep higher.
This compression is forming a medium-term triangle — and we’re now testing the upper boundary.
The broader structure is defined by:
Price is coiling between these converging trendlines.
This is not random noise. It’s a positioning structure.
Each approach to the descending resistance line has attracted supply. Sellers are defending that zone.
If this level holds again, it reinforces the idea that the triangle is still active — and unresolved.
Buyers have been stepping in at progressively higher levels. That’s the bullish counterargument.
But here’s the nuance: higher lows alone don’t equal trend continuation. Inside triangles, both sides press — until one side wins.
Compression often precedes expansion because:
When the break comes, it’s rarely quiet.
Zooming in, the recent rally is unfolding inside a smaller rising channel.
The slope is steady but not aggressive.
That’s important.
The channel shows:
Impulsive moves expand range. This one hasn’t.
Corrective rallies tend to:
That’s what we’re seeing.
Price is pressing into major resistance without momentum confirmation.
That tilts risk slightly toward rejection — for now.
RSI has recovered into the mid-60s.
It’s firm — but not extreme.
During the January impulse, momentum expanded aggressively. Now, RSI is rising in a measured way.
That suggests this rally may be more about positioning unwind than fresh demand.
If price tags resistance while RSI flattens or fails to make a higher high, short-term bearish divergence becomes a live risk.
Divergence at structural resistance inside compression patterns is something tactical traders watch closely.
The chart doesn’t exist in a vacuum.
Copper’s macro sensitivity makes the backdrop critical.
Copper remains highly sensitive to USD strength. A firm dollar or rising real yields tend to cap commodities.
If the USD stabilises or strengthens, it reinforces resistance overhead.
China accounts for a significant share of global copper demand. Infrastructure spending, property stabilisation, and manufacturing data all matter.s
Mixed signals from China recently align with a consolidation narrative — not a breakout surge.
For broader copper market context, traders can monitor data and updates via the London Metal Exchange.
After the January spike, positioning likely became crowded on the long side. Consolidation often works off that excess.
Until fresh catalysts emerge, price may continue rotating within structure.
If resistance holds:
This would complete another leg inside the broader consolidation.
If price closes decisively above the upper boundary:
Without expansion, breakouts can trap.
Not cleanly. It’s consolidating within a medium-term triangle.
It defines the current risk boundaries and likely breakout zones.
Failure at resistance and a break of the rising internal channel.
A sustained breakout above triangle resistance with momentum expansion.
Very. Dollar strength often pressures copper prices.
Compression suggests volatility expansion is coming — direction pending.
Alchemy Markets is a multi-asset brokerage providing retail traders with the same elite trading conditions, tools, and transparency typically reserved for institutions.
Select the categories and companies you wish to follow directly to your person rss feed.
Create Custom RSS FeedSign up and join over 5,000 professional members who receive personalized news alerts, curated professional connections, and more for free!
Binance has lowered its VIP 3 Wallet Assets threshold from $3 million to $1 million and will now count OTC Spot Trading Volume at a 4x multiplier toward VIP qualification, removing the previous VIP 4 cap and allowing eligible users to progress through the full tier framework up to VIP 9.
Retail futures trading leader NinjaTrader Group has appointed Mark Omens as Senior Vice President, Commercial Strategy, bringing a 25-year veteran of derivatives marketplace CME Group into a newly created role focused on exchange partnerships and enterprise growth.
Gold Price Action Forecast: Will XAU/USD Drop to $3930? Meta Description: Read our Gold price action forecast to see if XAU/USD will drop to $3930.
BitDelta Securities Financial Services LLC (“BitDelta Securities”) today announced that it has received full regulatory approval from the Capital Market Authority (“CMA”) of the United Arab Emirates under the Category 5 — Arrangement and Advice license framework (License No. 20200000439). The approval follows the firm's receipt of In-Principal Approval earlier this year and represents the successful conclusion of the CMA's full licensing process, including the satisfaction of capital requirements, governance appointments, and operational setup.
Crypto.com has received a $400 million strategic investment from Citadel Securities, valuing the firm at $20 billion. It marks the first institutional funding round in the company's history, aimed at accelerating its expansion into tokenised securities, derivatives and other asset classes.
WTI’s pullback into $79–82 is the first major test of the bullish Elliott Wave count, with buyers targeting a renewed break above $85.

BitDelta Securities has secured a full CMA Category 5 licence in the UAE and opened a regulated office in Business Bay, Dubai. The firm operates as an introducing broker, connecting investors with licensed international brokers across multiple asset classes, with CEO Dr. Demetrios Zamboglou commenting on the milestone.
Index volatility is asleep while single stocks fight it out underneath, credit refuses to confirm the equity rally, and a bare macro calendar hands next week to oil.
Digital assets and FX brokerage GC Exchange FZE (GCEX) has appointed Mohammed A. Mulla as a Board Member of its Dubai-based entity, part of the wider GCEX Group.
Learn what Blockchain-as-a-Service is, how it works, and why businesses are using BaaS to build blockchain applications without managing infrastructure.