just now

Liquidity Finder Ltd is incorporated in England and Wales, company number 10610740, registered address 167-169 Great Portland Street, Fifth Floor, London W1W 5PF, United Kingdom.
Published: just now

The Durable goods orders data is a monthly U.S. Census Bureau survey that tracks the industrial activity which provides as an important economic indicator for investors across manufacturing and technology sectors since they reflect business investment in equipment, these orders are necessary for forecasting economic growth and stock market performance.
Durable goods orders track or monitor new requests for high priced or expensive, long-lasting products which serves as an indicator of industrial function and future economic status. Due to large and low rarity orders like aircraft or in the aviation sector which can distort monthly data, analysts usually omit the volatile transportation and defense sectors to gain a visual of underlying trends.
Durable goods orders serve as an important economic key driver that provide investors predict manufacturing activity, staffing needs, and corporate earnings. Increasing order volumes displays business growth and consumer confidence as this signals an ascending economic trend and potential high stock prices. Since capital goods demand longer production timeframe, these orders are usually useful for estimating the high probability of long-term sales and company stability across the manufacturing and technology sectors.
Global trade conflicts may deter businesses and consumers from acquiring new equipment this is due to the heightened uncertainty situation and economic fragile.
It measures growth plans as to when companies purchase on expensive, long-lasting equipment, it means they are betting on the future resulting to increase in labor by preparing to hire more people and build more products.
It tracks the factory pulse Manufacturing is a massive part of the economy. If factories are busy, the economy is usually healthy. If they are quiet, it is a warning sign.
It also shifts the markets and investors to view at these numbers to guess what the Federal Reserve will do with the interest rate decision and how well the overall economy (GDP or Gross Domestic Product) will also perform.
Keys to check for the data
With Strong Orders mean the economy is hot and this usually boosts the local currency or the U.S. dollar.
With Weak Orders mean the economy is cooling as this may signify a potential recession.
The Durable Goods Orders index acts as a core early caution signal that allows markets or traders to expect some shifts in economic status and Federal Reserve policy based on how the actual data deviates from market expectations.
Currency Markets with US dollar focus
Positive news means positive data beats drive the USD higher as investors anticipate a more hawkish Federal Reserve policy to control growth and inflation.
Negative news means a data miss exerts downward pressure on the USD as investors expect a shift toward dovish policies and lower interest rates.
Bond Markets the Yields and Fixed Income
The inflation expectations plus the effect of strong orders signify an increased inflationary pressure which may cause the Treasury yields to increase as investors demand higher returns, while weak data sparks a flight to quality that lowers yields.
Equity Markets or the Stocks
With the cyclical stocks & sentiment strong orders act as a momentum for industrial and technology stocks, while steady performance during economic uncertainty provides a crucial floor for comprehensive equity prices.
Commodities precious metals like Gold
The Opportunity Cost Trade Gold typically falls when strong data boosts yields and the USD, but rallies during economic weakness as investors seek safe-haven assets.
The data with example below as its influence on S&P500 index
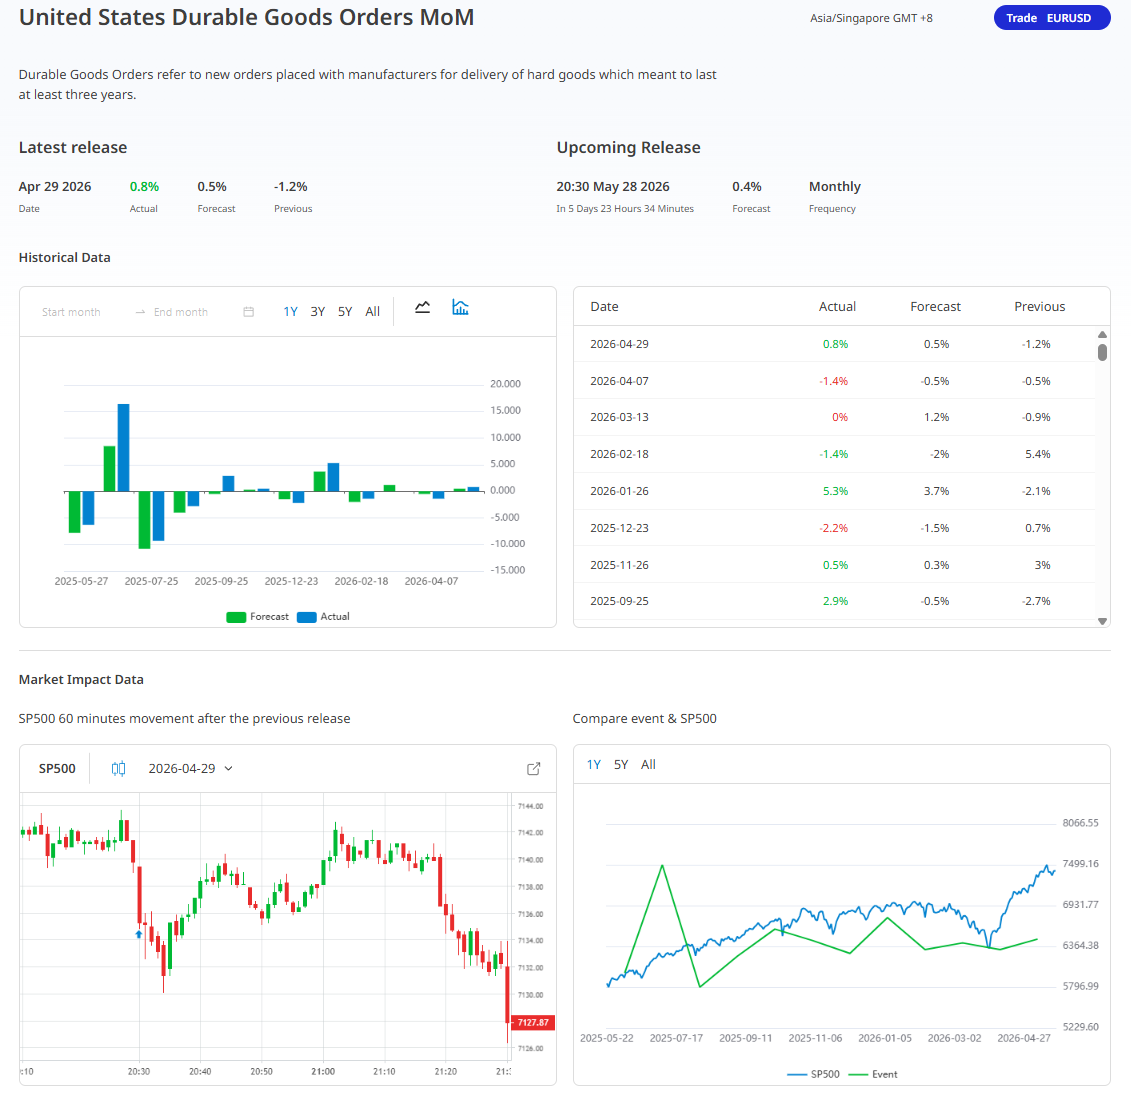
The Durable Goods Orders report acts as a measure for the manufacturing industry that tracks items designed to last with at least three years, such as industrial machinery, vehicles, and appliances. And when gauging the changes in new orders placed with manufacturers, this benchmark provides direct accurate understanding into both investment plans and consumer demand. When these orders expand this may signal a strong economy where businesses may feel confident, enhanced as consumers are willing to spend, whereas a decline may suggest a cooling of economic activity.
In April 29, 2026 it shows a positive trend seen that the actual growth of 0.8% exceeded the expectations or forecast of 0.5% this suggests a stronger performance than expected. As looking back at the historical data, the sector has experienced significant instability over the past year along with swings, such as a sharp 5.3% increase in January 2026 followed by a 1.4% contraction in February, which highlights the uneven nature of manufacturing demand.
To have deeper insight on how this data influence the stock market, the analysis examines the S&P 500's reaction. A look at the immediate, hour-long movement after the April 29 release shows the market's high sensitivity and instability in the moments following such announcements. While the long-term chart shows the S&P 500 trending upward over the past year, the durable goods data has followed a much more erratic path, revealing that the two do not move in perfect lockstep.
When the data is under forecast, historically based, the S&P 500 has historically been more likely to decline, with a 67 probability of a decline. Even when the data has performed over forecast, the market reaction has been a coin toss like 50/50 with splitting perfectly between rising and falling 50% of the time. This serves as a reminder that while manufacturing orders is an important indicator, they are only one piece of a much larger and more complex puzzle that determines market performance.
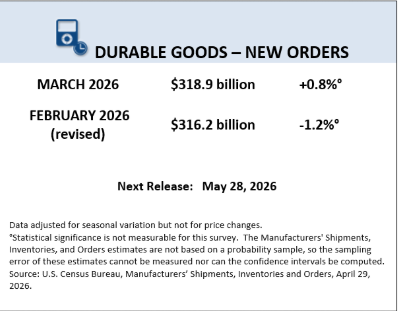
Source: U.S. Census Bureau
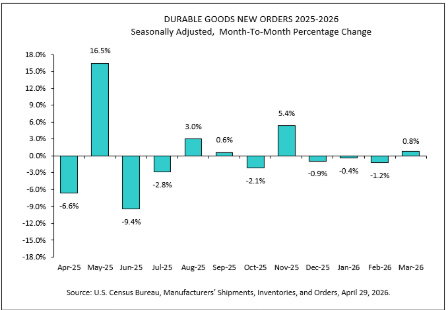
Source: U.S. Census Bureau
Trading with the Data
Confirm your directional bias by ensuring your trade really matches with the long-term momentum of the Core (ex-transportation) index.
Prioritize the Core figure over the headline number to ensure your analysis remains focused on underlying private-sector demand rather than noise from volatile sectors or energy shocks.
Avoid the initial news volatility and wait for the price to return to your established Fibonacci or EMA confluence levels before entering.
Only initiate a position after the news impact has settled and price action confirms your bias with a structural reversal or continuation pattern.
Reduce your position size during news events to prevent market noise from prematurely triggering your stop-losses.
Organize its market structure over the news outcome by exiting the trade if the price disappoints to hold your identified support or resistance levels.
Adjust and synchronize the data deviation with the long-term trend, wait for a technical retest of your key levels, and enter only when market movement provides direct or clear confirmation.
Disclaimer: This content may have been written by a third party. ACY makes no representation or warranty and assumes no liability as to the accuracy or completeness of the information provided, nor any loss arising from any investment based on a recommendation, forecast or other information supplies by any third-party. This content is information only, and does not constitute financial, investment or other advice on which you can rely.
ACY Securities is one of Australia's fastest growing multi-asset online trading providers, offering ultra-low-cost trading, rock-solid execution, technologically superior account management and premium market analysis.
Select the categories and companies you wish to follow directly to your person rss feed.
Create Custom RSS FeedSign up and join over 5,000 professional members who receive personalized news alerts, curated professional connections, and more for free!
Retail futures trading leader NinjaTrader Group has appointed Mark Omens as Senior Vice President, Commercial Strategy, bringing a 25-year veteran of derivatives marketplace CME Group into a newly created role focused on exchange partnerships and enterprise growth.
Gold Price Action Forecast: Will XAU/USD Drop to $3930? Meta Description: Read our Gold price action forecast to see if XAU/USD will drop to $3930.
BitDelta Securities Financial Services LLC (“BitDelta Securities”) today announced that it has received full regulatory approval from the Capital Market Authority (“CMA”) of the United Arab Emirates under the Category 5 — Arrangement and Advice license framework (License No. 20200000439). The approval follows the firm's receipt of In-Principal Approval earlier this year and represents the successful conclusion of the CMA's full licensing process, including the satisfaction of capital requirements, governance appointments, and operational setup.
Crypto.com has received a $400 million strategic investment from Citadel Securities, valuing the firm at $20 billion. It marks the first institutional funding round in the company's history, aimed at accelerating its expansion into tokenised securities, derivatives and other asset classes.
WTI’s pullback into $79–82 is the first major test of the bullish Elliott Wave count, with buyers targeting a renewed break above $85.

BitDelta Securities has secured a full CMA Category 5 licence in the UAE and opened a regulated office in Business Bay, Dubai. The firm operates as an introducing broker, connecting investors with licensed international brokers across multiple asset classes, with CEO Dr. Demetrios Zamboglou commenting on the milestone.
Index volatility is asleep while single stocks fight it out underneath, credit refuses to confirm the equity rally, and a bare macro calendar hands next week to oil.
Digital assets and FX brokerage GC Exchange FZE (GCEX) has appointed Mohammed A. Mulla as a Board Member of its Dubai-based entity, part of the wider GCEX Group.
Learn what Blockchain-as-a-Service is, how it works, and why businesses are using BaaS to build blockchain applications without managing infrastructure.
CFDs vs stocks compared on leverage, ownership, costs, dividends, taxes, and risk. Learn the differences between stocks and CFDs and discover which suits your investing or trading goals.


