just now


Liquidity Finder Ltd is incorporated in England and Wales, company number 10610740, registered address 167-169 Great Portland Street, Fifth Floor, London W1W 5PF, United Kingdom.
Published: just now


GBP/USD Price Action Forecast: Can Key Support Trigger the Next Bullish Move?
GBP/USD continues to show a bullish higher-timeframe structure, with both the weekly and daily charts supporting the possibility of further upside.
The weekly chart remains in an established bullish trend, with price potentially forming a Higher Low (HL) around a major support area. Price is also retesting a previous head-and-shoulders neckline and a key previous structure point, adding further confluence around the current area.
Meanwhile, the daily chart is showing bullish rejection from support while maintaining its broader bullish structure.
With price also trading above the 50 EMA on both timeframes, the 1.35007–1.34540 support zone could become the key area determining GBP/USD's next directional move.

Weekly Timeframe Price Action Analysis. Price retesting Weekly and Daily Support And HAS Neckline
The GBP/USD weekly chart continues to trade within a clear bullish market structure.
Price is currently pulling back toward a major Weekly and Daily support area and could be developing another Higher Low (HL).
If buyers continue defending this area, the Higher Low would reinforce the existing bullish structure and could provide the foundation for another continuation higher.
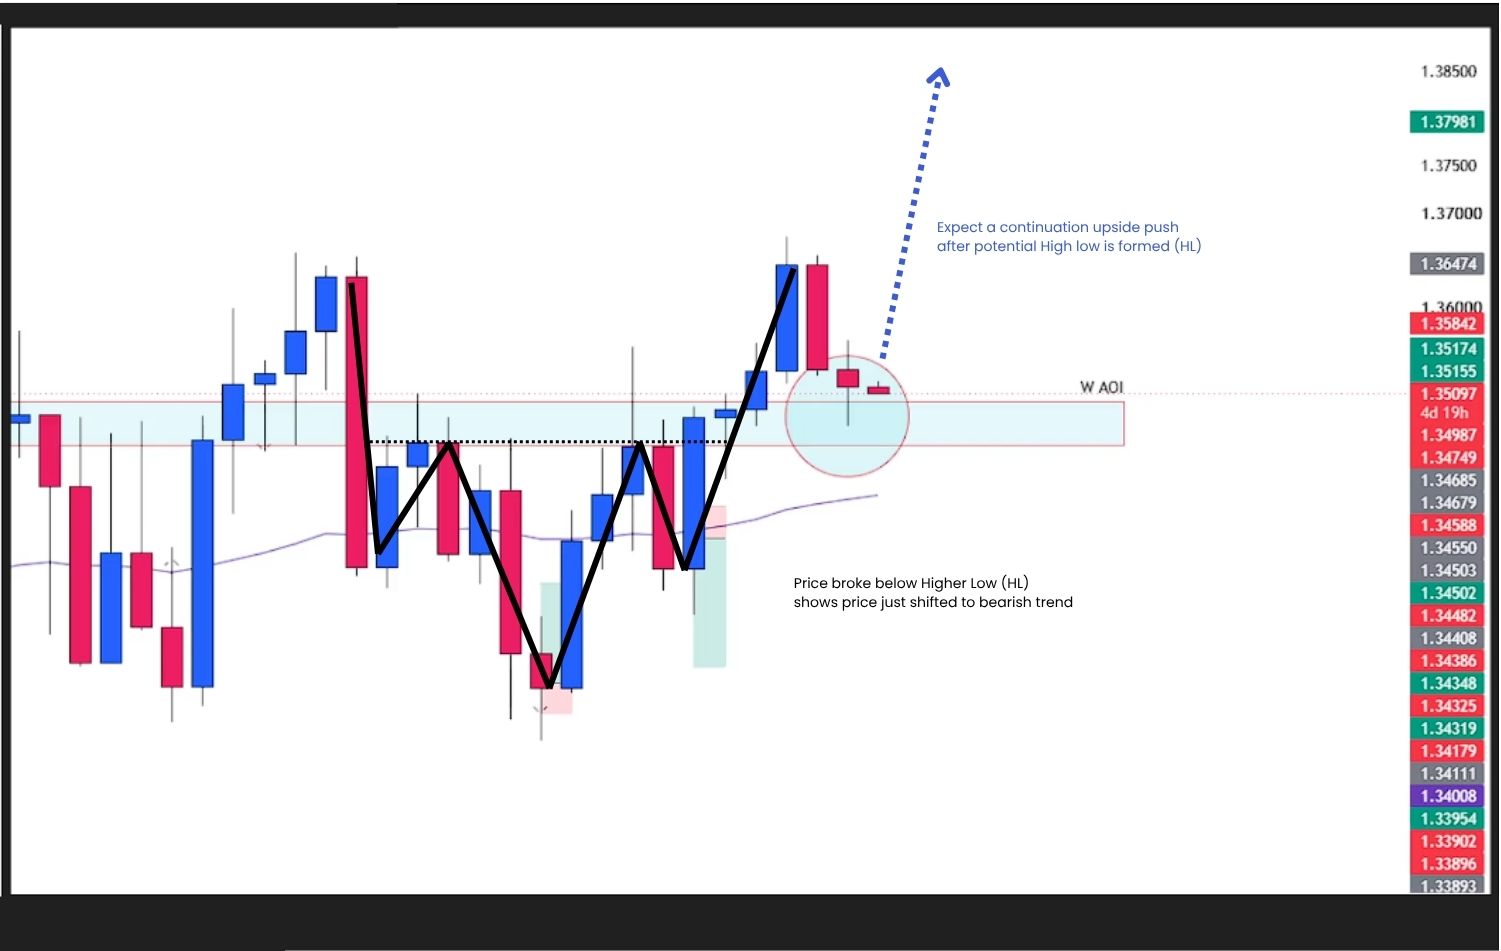
Weekly Timeframe Price Action Analysis
Additional confluence comes from price retesting the neckline of a previous head-and-shoulders structure, alongside an important previous structure point. These overlapping technical levels increase the significance of the current support area.
Another important confirmation is price's position relative to the weekly 50 EMA. GBP/USD remains above the moving average, supporting the broader bullish trend.
Bullish candlestick confirmation around the support area also suggests that buyers are beginning to respond.
Weekly chart observations:

Daily Timeframe Price Action Analysis. Price Retesting Weekly and Daily Support level and 50 EMA
The daily chart provides additional bullish confluence.
GBP/USD remains in a clear daily bullish trend, with price continuing to trade above the daily 50 EMA.
More importantly, price is showing bullish rejection around support, indicating that buyers are responding to the current pullback.
The current reaction is also developing around the Weekly and Daily support zone, strengthening the technical importance of this area.
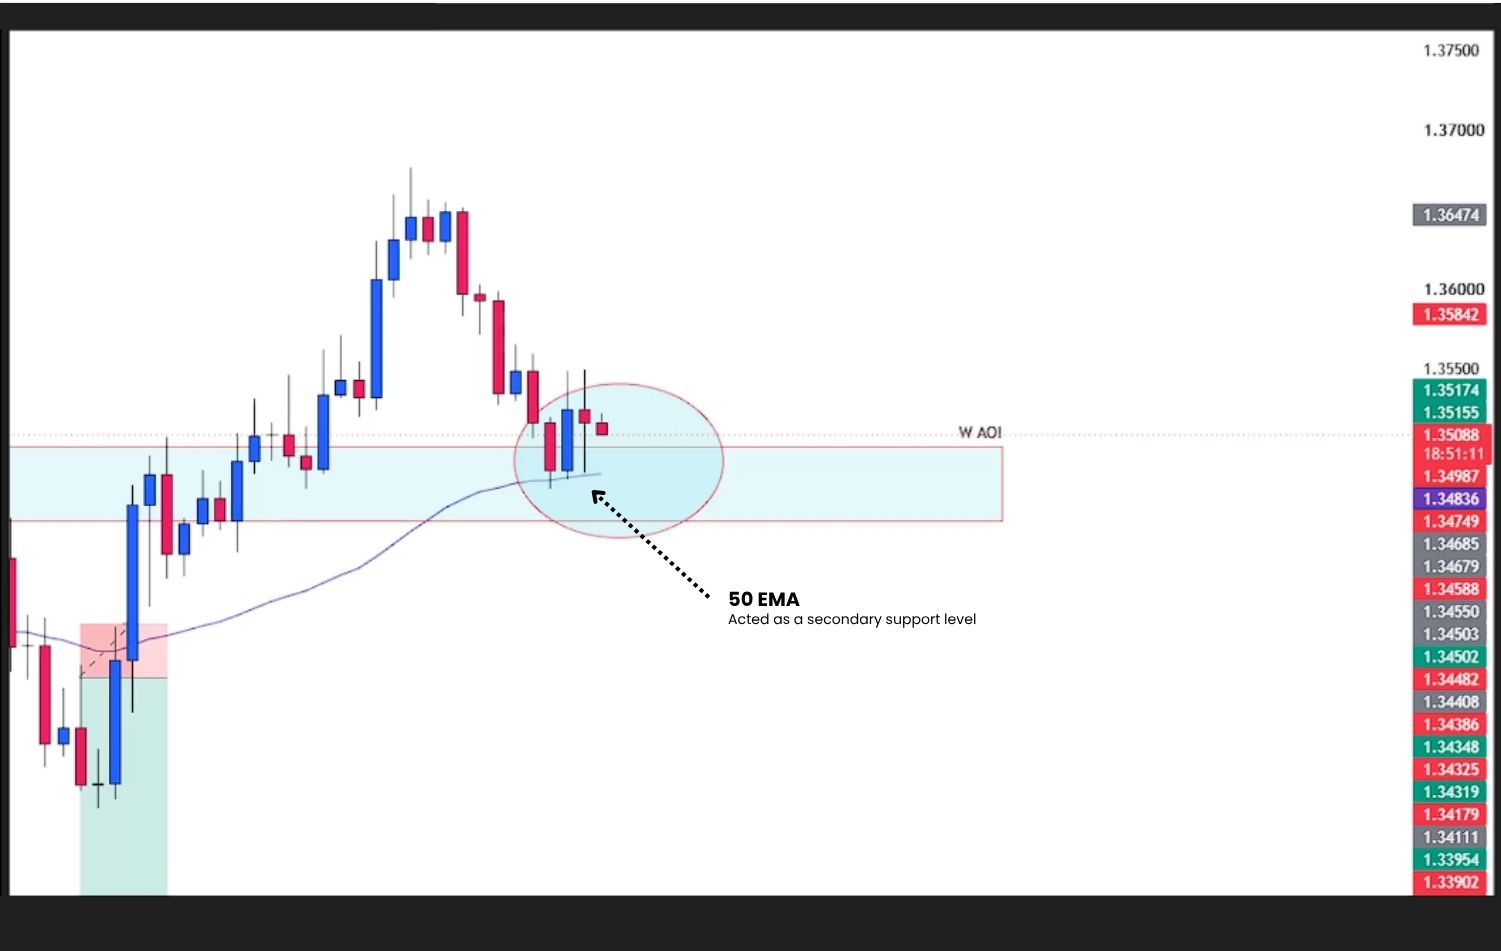
Daily Timeframe Price Action Analysis
A major support level holding within an established bullish structure can provide additional confirmation when combined with bullish rejection and price trading above the 50 EMA.
As long as the broader support zone continues to hold, the technical structure remains supportive of another potential move higher.
Daily chart observations:
Rather than predicting GBP/USD's next move, traders can monitor how price reacts around the 1.35007–1.34540 Weekly and Daily support zone.
This area is important because it could determine whether the current pullback develops into a Higher Low or whether sellers gain enough momentum to invalidate the bullish setup.

Daily Timeframe Price Action Analysis. Bullish Bias Anticipation
The primary bullish scenario requires GBP/USD to hold the 1.35007–1.34540 support zone and provide clear bullish confirmation.
Ideally, price should retest the area, reject lower prices, and close back above support before continuation is considered.
A potential confirmation sequence could look like:
Retest → Bullish Rejection → Candlestick Confirmation → Entry

Daily Timeframe Price Action Analysis. Bullish Take Profit and Stop-loss Placement
Note: The bullish scenario currently carries stronger technical confluence because it aligns with both the weekly and daily bullish trends. Confirmation around the support zone remains important before considering continuation.

Daily Timeframe Price Action Analysis. Bullish Take Profit and Stop-loss Placement
The alternative scenario develops if GBP/USD breaks decisively below the 1.35007–1.34540 support zone.
A break alone would not necessarily provide enough confirmation.
Ideally, price would close below the support zone, retest it from underneath, and show bearish rejection. This would indicate that previous support is beginning to act as resistance.
A potential confirmation sequence could look like:
Breakdown → Retest → Bearish Rejection → Candlestick Confirmation → Entry

Daily Timeframe Price Action Analysis. Bearish Bias Anticipation
Note: The bearish scenario currently carries lower technical confluence because it would move against the prevailing weekly and daily bullish structures. A confirmed breakdown and retest of support would therefore be important before considering a deeper move lower.
GBP/USD remains bullish from a higher-timeframe perspective, with both the weekly and daily charts maintaining bullish market structures.
The combination of a potential weekly Higher Low, bullish candlestick confirmation, price trading above the weekly and daily 50 EMA, a head-and-shoulders neckline retest, and a previous structure-point retest creates multiple layers of bullish confluence.
The 1.35007–1.34540 support zone is now the key area to monitor.
If buyers successfully defend this zone and bullish confirmation develops, 1.36325 becomes the next potential upside target.
However, if GBP/USD breaks below 1.34540, successfully retests the area as resistance, and produces bearish confirmation, the technical picture could weaken and bring 1.33450 into focus.
For now, the higher-timeframe structure favors buyers — but confirmation at the key level should come before execution.
If you want to develop a professional trading mindset while learning how to identify high-probability price action setups across Gold, Forex, Crypto, Commodities and Indices, continue following our market analysis and educational guides.
For more in-depth market breakdowns, real-time analysis, and structured learning content, you can join our Discord community inside ACY Server:
Discord Server - ACY Securities Server
Start your live trading journey today!
• Trade Forex, indices, gold, crypto and other global markets
• Access powerful platforms including ACY, MT4, MT5, and Copy Trading tools
Move from learning simple price action to executing it in the real market with confidence!
Create an Account. Start Your Live Trading Now!
Build a strong trading foundation with step-by-step lessons designed for beginners:
Learn how to read market structure, identify key levels, and trade high-probability setups using pure price action.
Ready to learn simple price action strategy? Here’s how to do it step by step:
Learn how to identify bullish, bearish, and sideways markets using price action to make more informed trading decisions:
Ready to learn and capitalize the repetitive patterns in the markets? Here’s how to do it step by step:
Discover how candlestick patterns can help confirm market direction:
Gold is still one of the most traded assets, here’s how to trade it with confidence:
Your mindset is what separates steady growth from costly mistakes. Focus on these essentials:
Develop the mindset of a professional trader by mastering discipline, emotional control, patience, and consistency to achieve long-term trading success:
Learn how to set TP and SL levels to manage risk, protect your capital, and plan better trades.
Learn the essential risk management strategies to protect your capital, manage losses, and trade with confidence:
Not sure where to begin? Here’s a simple roadmap to guide you:
By building step by step; from basics → real trading → mastering the craft, you’ll gain clarity, confidence, and steady progress without ever feeling overwhelmed.
Follow me for more daily market and educational insights!
Ruffy Grant B. Capacio - LinkedIn | Telegram | YouTube
ACY Securities - Discord
Disclaimer:
Trading forex and derivative instruments involves substantial risk and may not be suitable for all individuals. Only use funds that you are prepared to lose. It is important to understand how these markets work and the risks involved before trading, and to seek independent financial advice if needed. All market analysis and insights shared are intended for educational and informational purposes only and should not be considered financial or investment advice. September 7, 2026.
ACY Securities is one of Australia's fastest growing multi-asset online trading providers, offering ultra-low-cost trading, rock-solid execution, technologically superior account management and premium market analysis.

Select the categories and companies you wish to follow directly to your person rss feed.
Create Custom RSS FeedSign up and join over 5,000 professional members who receive personalized news alerts, curated professional connections, and more for free!
On 7–9 October, Spotware Systems will be at iFX EXPO Asia 2026, at the Hong Kong Convention and Exhibition Centre, Booth 122.
The platform is designed around a simple idea: make complex operations easier to manage from one place.
AUD/CHF price forecast examines resistance at 0.58201–0.58365, a head-and-shoulders retest, and confirmation for targets at 0.57732 or 0.58750.
A technical and fundamental analysis of the S&P 500 ahead of key economic releases, highlighting critical support levels and Federal Reserve catalysts.
iFX EXPO Asia 2026 is almost here. Meet the Your Bourse team at Super Booth 97 in Hong Kong from 7–9 October.
During Forex Expo Dubai 2026, Adnan Khan, CEO of 4XPORTAL, met with Sam Low, the founder of Liquidity Finder.
ATARIA CRM is a centralized platform designed for fintech teams to manage account operations, verification, fund management, and support in one place. With desktop and mobile access, it helps businesses stay connected, organized, and efficient.
EUR/AUD hits the 1.60500 target after rejecting 1.61715–1.62300 resistance. Review the bearish price action setup and why trade confirmation mattered.
Get an inside look at how rising Treasury yields and sector shifts into healthcare are impacting S&P 500 market dynamics, technical levels, and key economic drivers.
Understand XAUUSD support and resistance with simple gold chart examples. Learn to identify key zones, assess price reactions, and avoid beginner mistakes.