just now
Liquidity Finder Ltd is incorporated in England and Wales, company number 10610740, registered address 167-169 Great Portland Street, Fifth Floor, London W1W 5PF, United Kingdom.
Published: just now

The rally to $3,500 is not just about technical breakouts — it reflects a deeper macro shift. Several fundamental and news catalysts are fueling gold’s drive toward all-time highs:
Federal Reserve Policy Outlook: Markets maintain high expectations for a September rate cut, with CME FedWatch Tool showing probabilities heavily tilted toward easing. Lower yields diminish the opportunity cost of holding gold, a classic driver of sustained upside.
U.S. Dollar Weakness: The greenback has softened as investors price in a more dovish Fed and slower growth momentum. The dollar’s decline adds fuel to gold’s advance, reflecting their strong inverse correlation.
Geopolitical Tensions: Persistent instability in the Middle East and continued trade risks between the U.S. and China have reinforced gold’s safe-haven bid. Investors are rotating into defensive assets, which has strengthened bullion’s role as a hedge.
Institutional Conviction: Large banks, including HSBC and J.P. Morgan, maintain forecasts for gold stretching into the $3,600–$4,000 zone, reinforcing the notion that the current push is not merely speculative but institutionally supported.
Together, these catalysts provide the fundamental backbone for gold’s aggressive rally from $3,400 to $3,500 — a move that now places all-time highs firmly within reach.
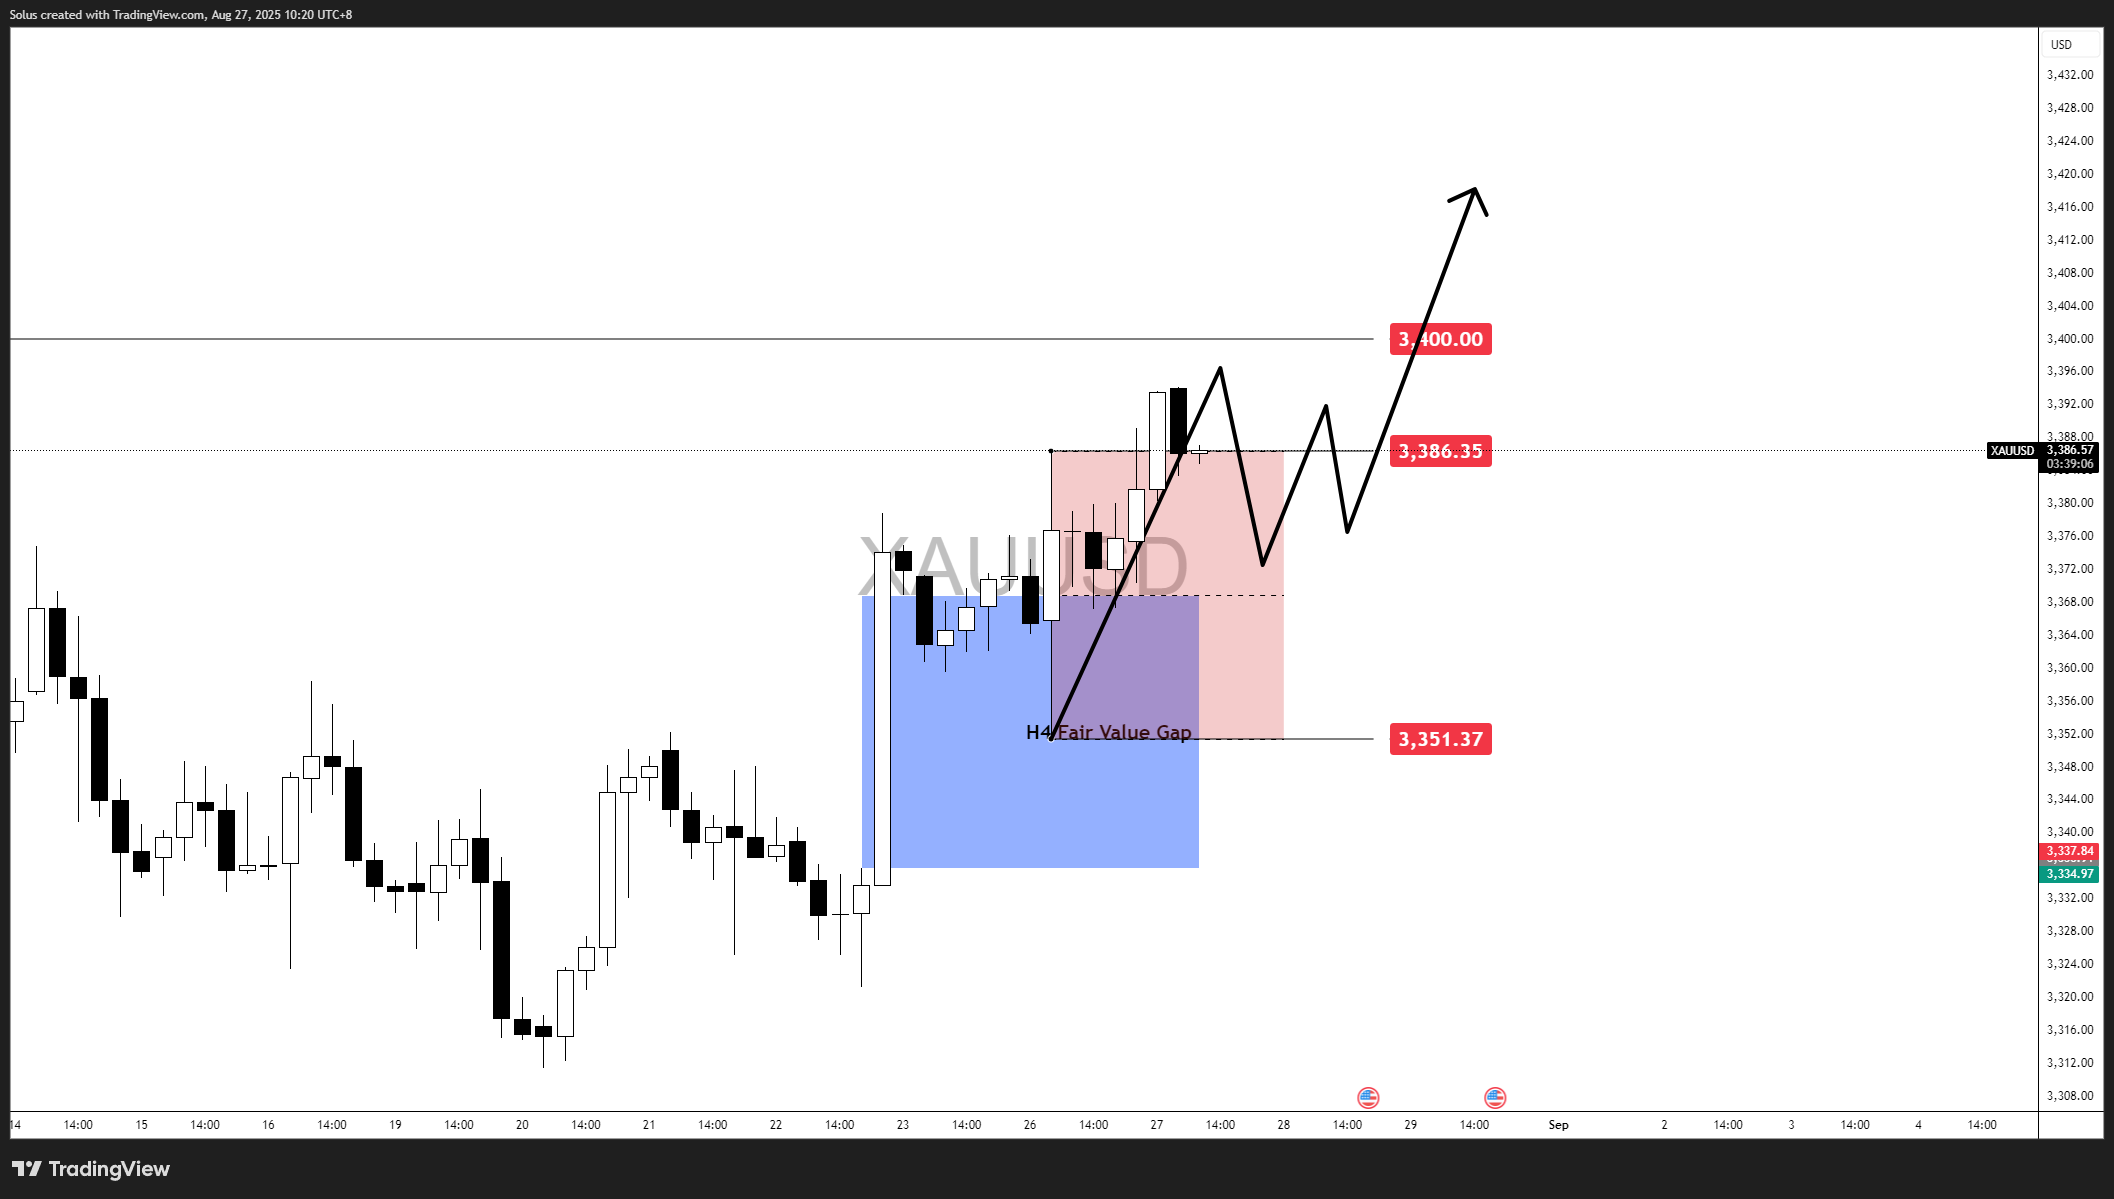
In last week’s gold forecast, we highlighted the importance of the $3,386–$3,400 zone, where price was consolidating after filling a higher-timeframe Fair Value Gap (FVG). The projection suggested gold would likely respect that demand region before continuing higher.
That expectation was validated:
This sets the stage for today’s market structure — a rally that has already carried gold close to $3,500.
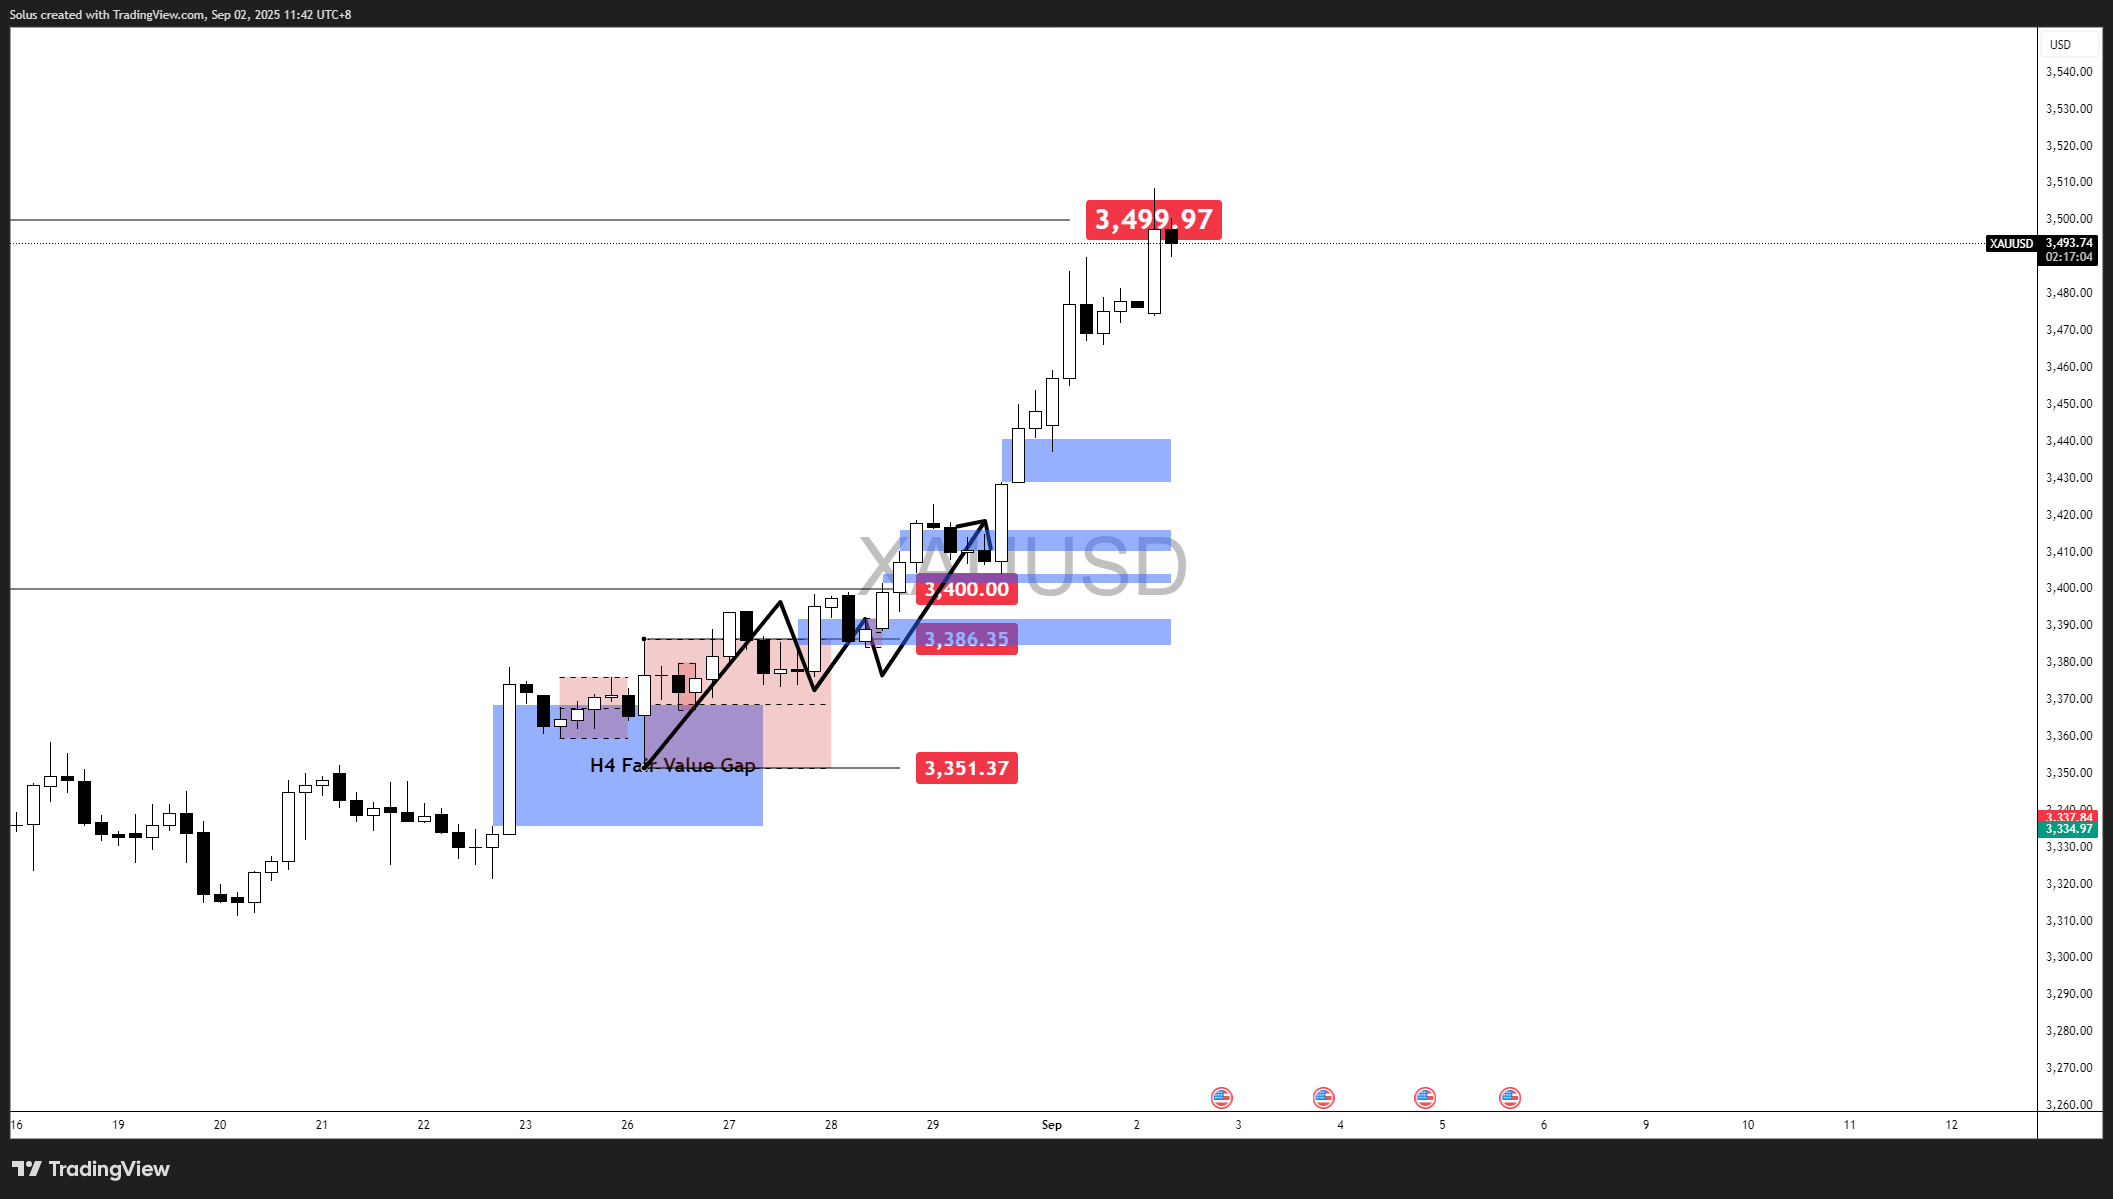
Gold is now trading at $3,500, a critical level that places the market just shy of all-time highs. The difference between the previous leg and the current surge is striking:
This acceleration implies that gold is firmly in a price discovery phase, with the potential to test and surpass its all-time high if momentum persists.
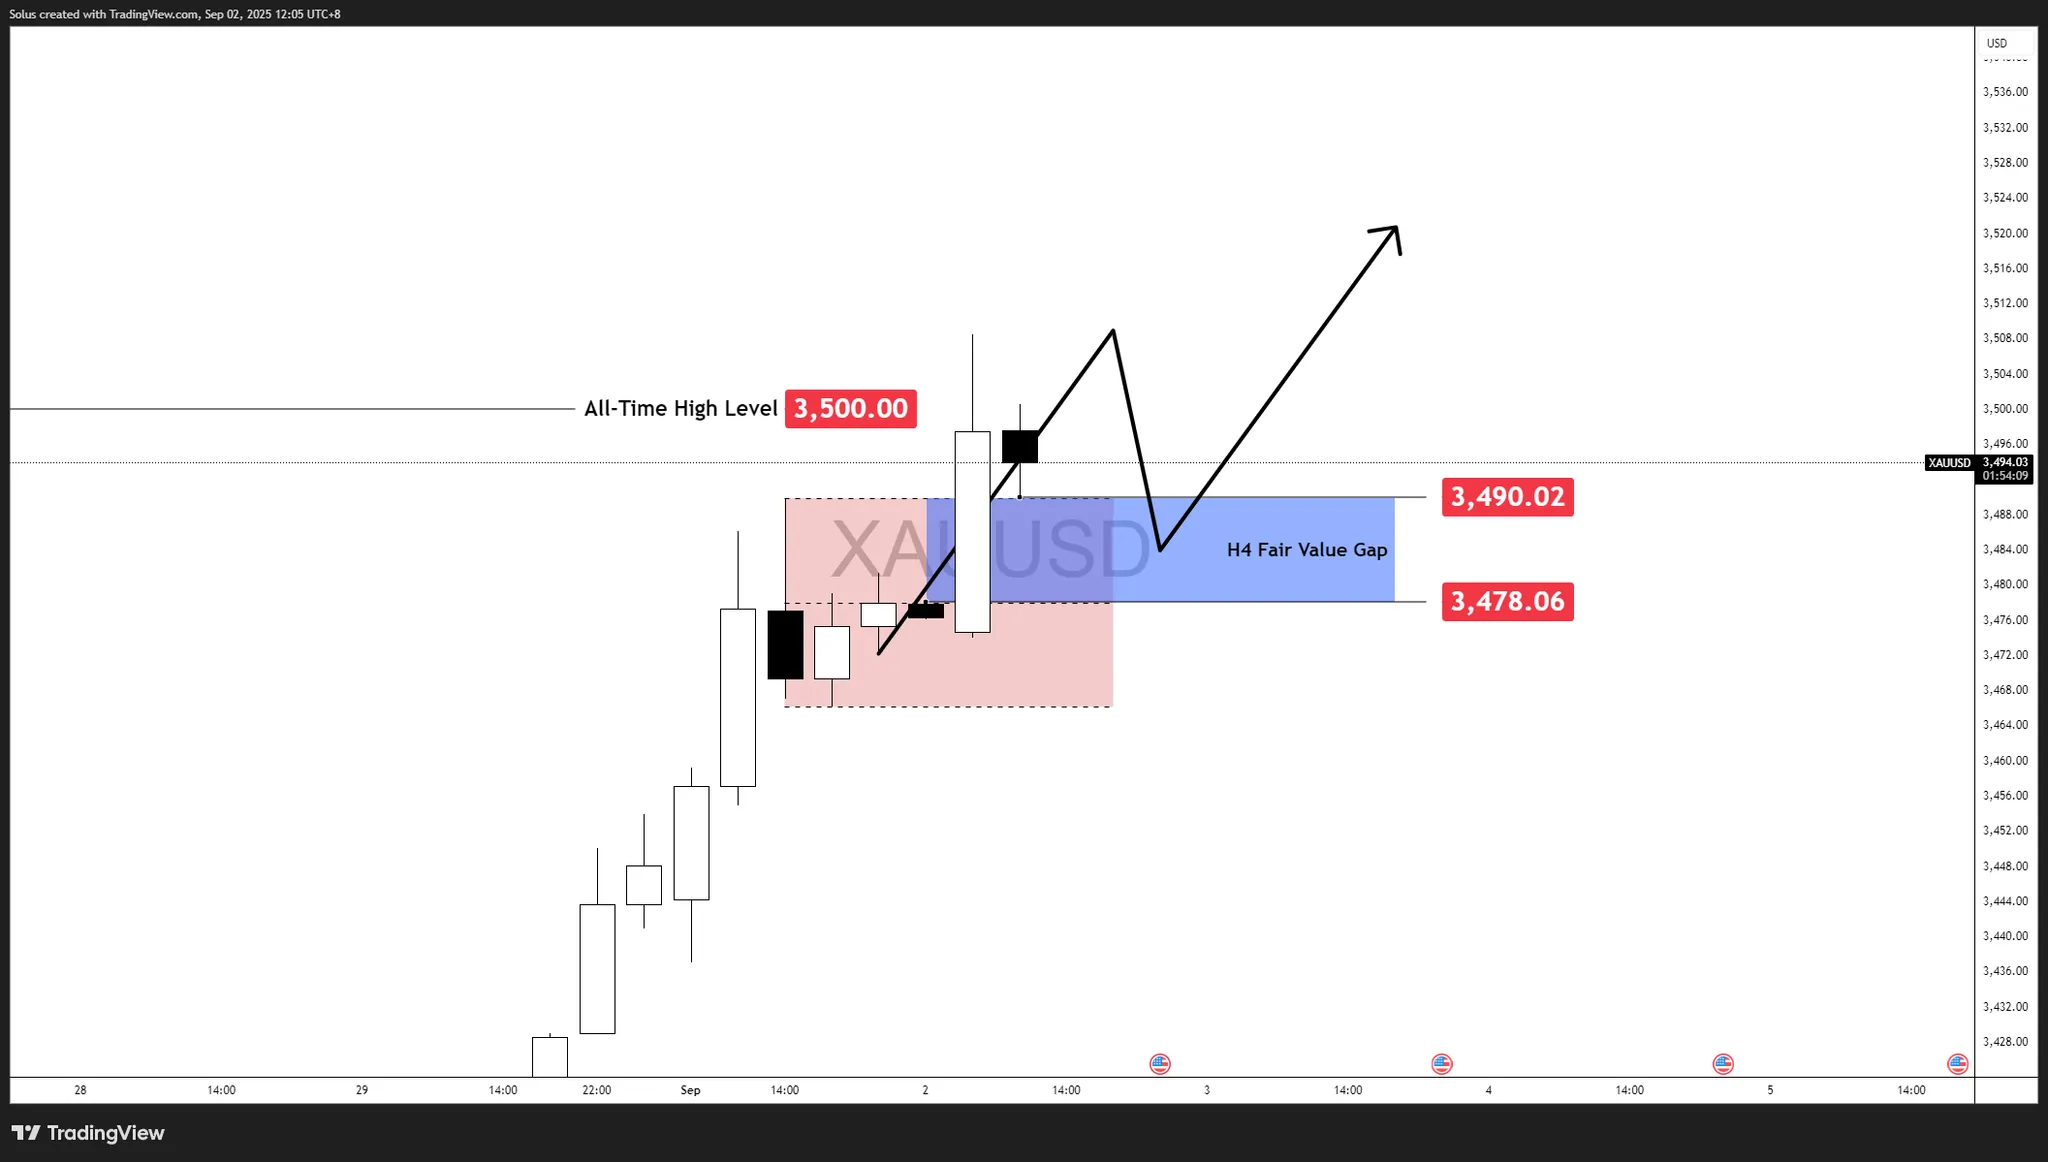
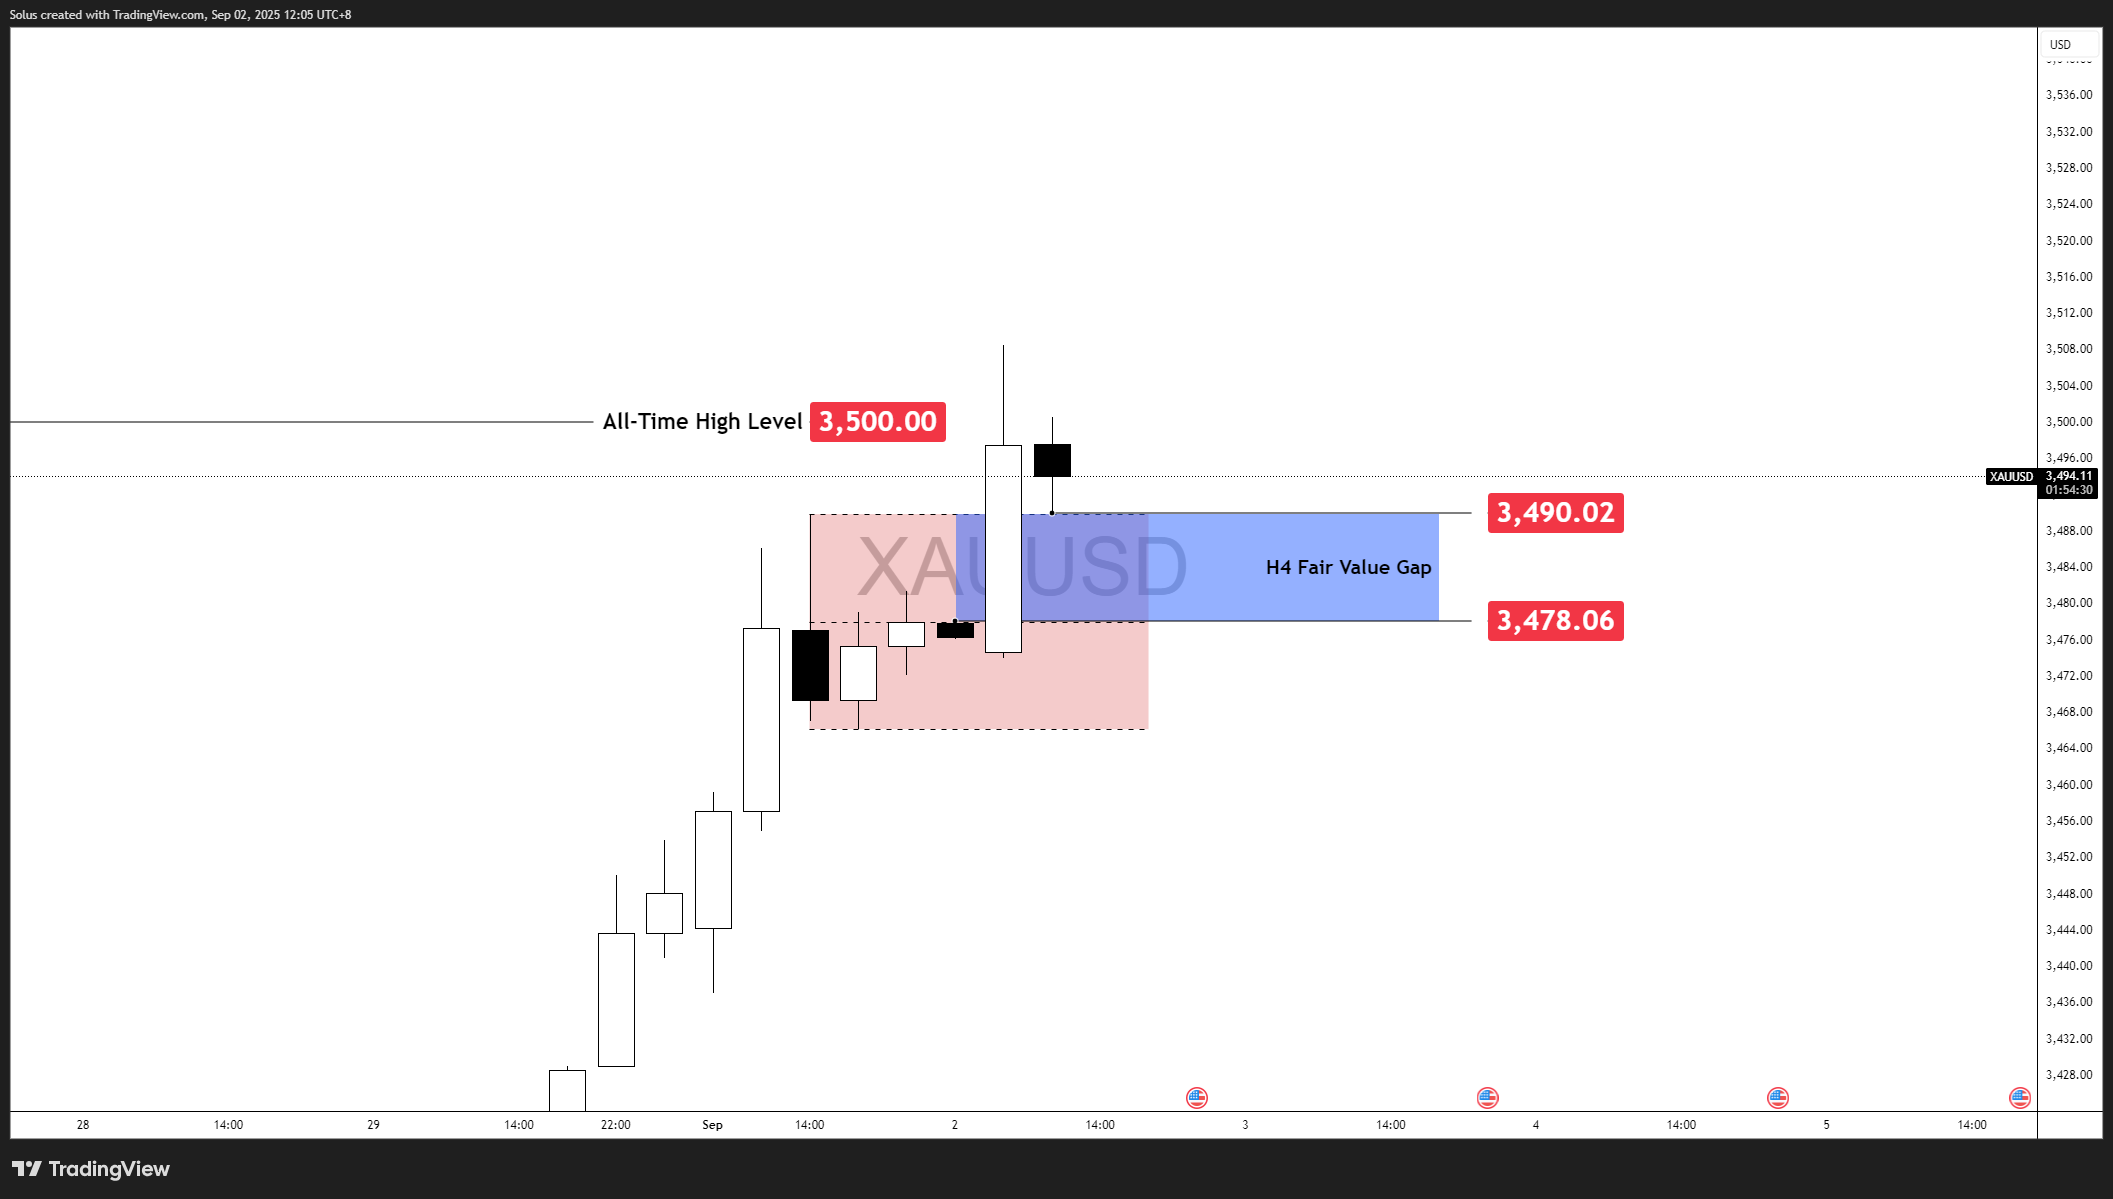
Gold is now hovering just under the $3,500 all-time high level, a key psychological and structural barrier. The sharp rally left behind an H4 Fair Value Gap between $3,478–$3,490, which may act as a magnet for short-term liquidity. This means that while bulls remain in control, the market could revisit the FVG before attempting another breakout.
The question traders face is whether gold will consolidate and push higher into price discovery, or reject $3,500 and retrace deeper into untested demand zones.
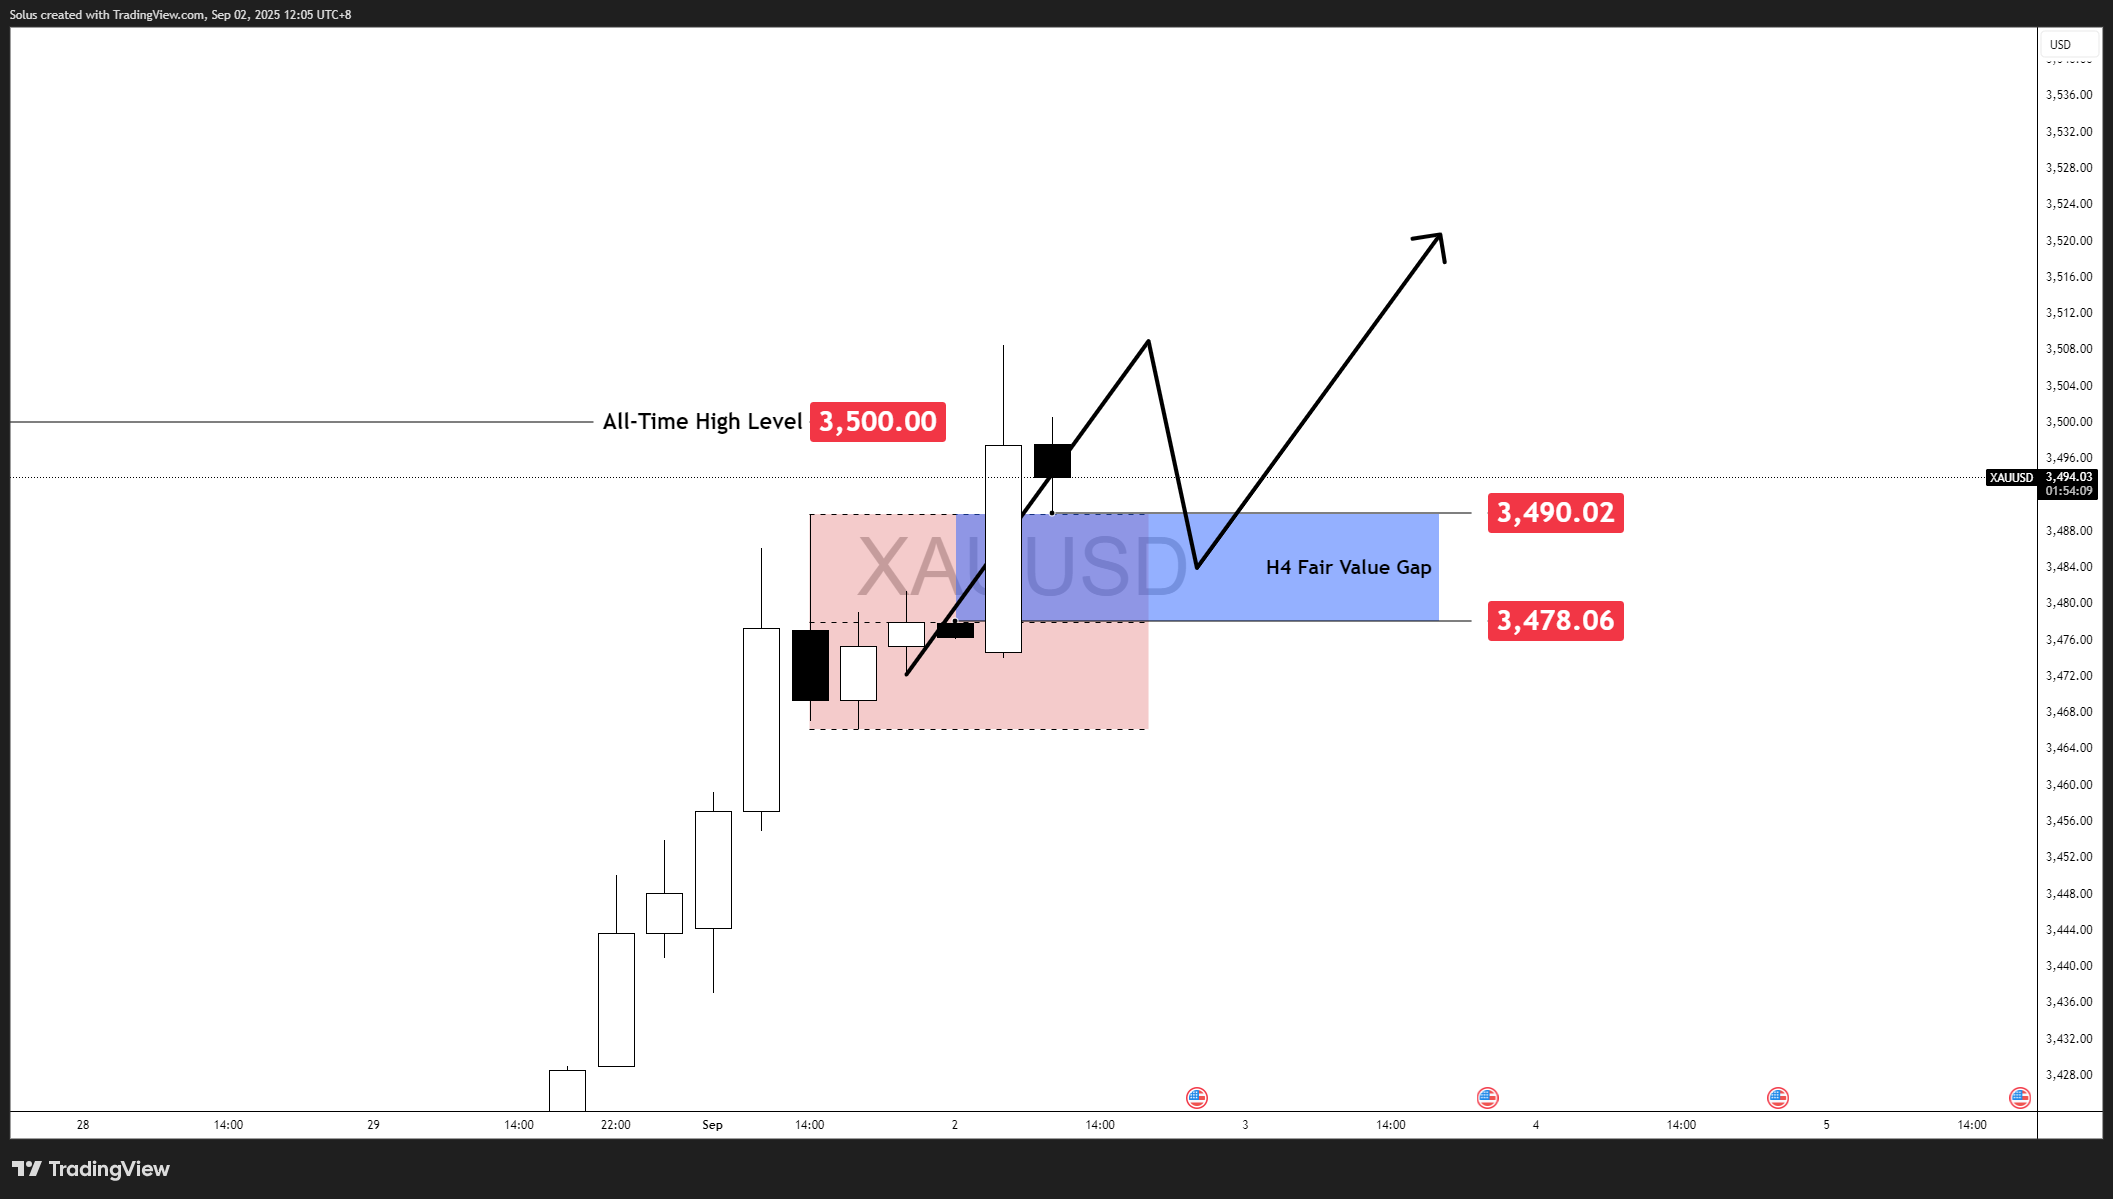
If gold sustains momentum above $3,500, it signals that institutions are absorbing supply and driving the market into fresh record territory. The FVG at $3,478–$3,490 could serve as a launchpad if retested, offering buyers a liquidity-based entry before continuation.
Bullish Targets:
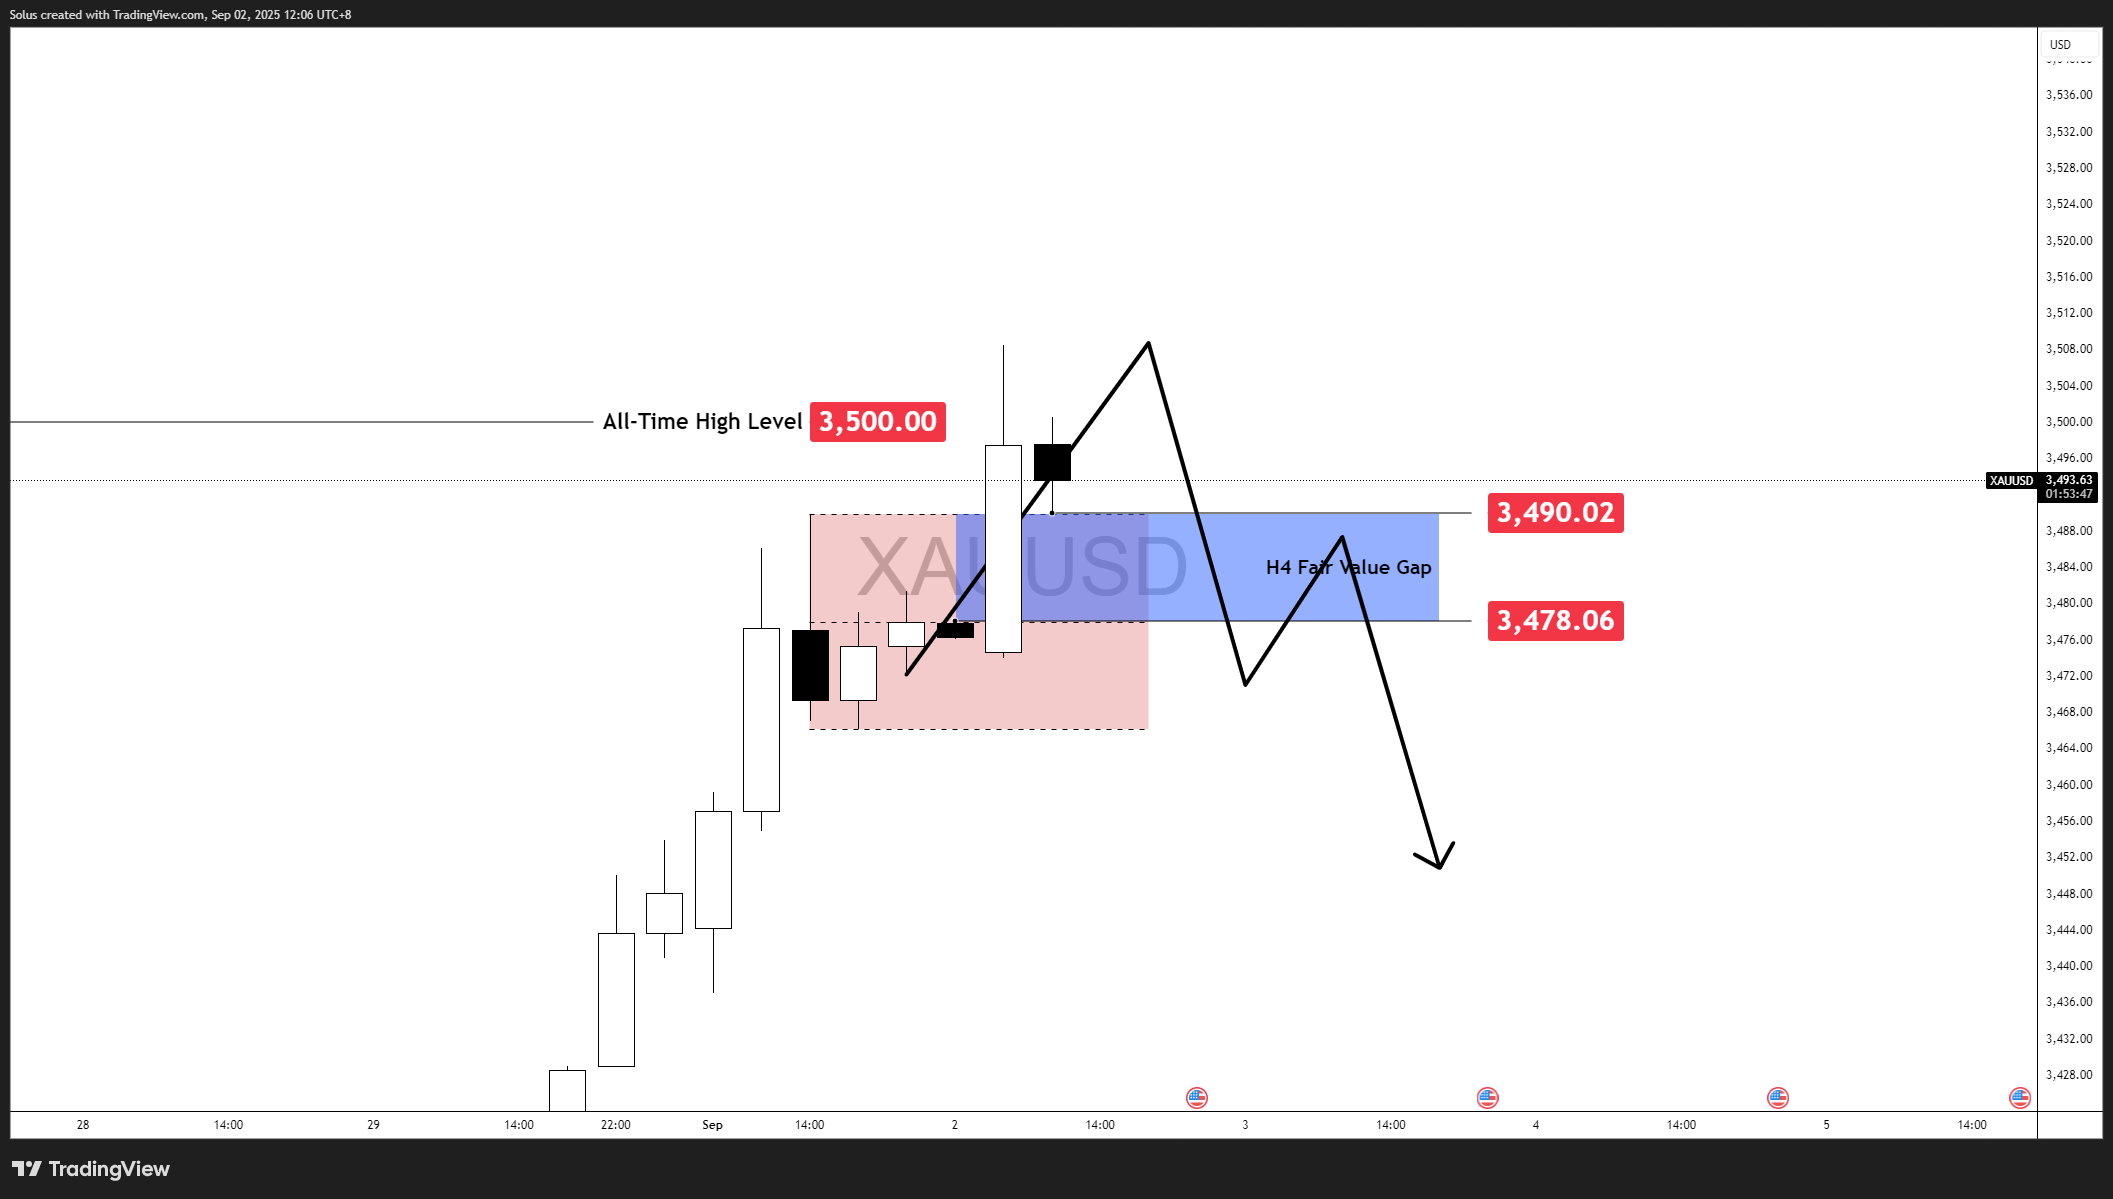
If gold fails to hold above $3,500 and sees strong rejection, price may rotate lower to fill imbalances. The H4 FVG between $3,478–$3,490 is the first key demand area. Failure to hold this zone could trigger a deeper retracement toward $3,450–$3,440, or even extend back to $3,400, where prior structure and liquidity reside.
Bearish Targets:
The $3,500 level is the defining pivot: a sustained breakout turns the path bullish toward $3,600, while a rejection opens the door for liquidity-driven pullbacks into the $3,478–$3,490 demand zone. Traders should anchor bias on how gold interacts with this key level in the coming sessions.
It’s time to go from theory to execution - risk-free.
Create an Account. Start Your Free Demo!
Looking for step-by-step approaches you can plug straight into the charts? Start here:
Sharpen your edge with proven tools and frameworks:
News moves markets fast. Learn how to keep pace with SMC-based playbooks:
From NASDAQ opens to DAX trends, here’s how to approach indices like a pro:
Gold remains one of the most traded assets — here’s how to approach it with confidence:
Candlesticks are the building blocks of price action. Master the most powerful ones:
Ready to go intraday? Here’s how to build consistency step by step:
Markets swing between calm and chaos. Learn to read risk-on vs risk-off like a pro:
Step inside the playbook of institutional traders with SMC concepts explained:
Forex pairs aren’t created equal — some are stable, some are volatile, others tied to commodities or sessions.
If you’ve ever been stopped out right before the market reverses — this is why:
Mindset is the deciding factor between growth and blowups. Explore these essentials:
The real edge in trading isn’t strategy — it’s how you protect your capital:
If you’re not sure where to start, follow this roadmap:
This way, you’ll grow from foundation → application → mastery, instead of jumping around randomly.
Follow me for more daily market insights!
Jasper Osita - LinkedIn - FXStreet - YouTube
This content may have been written by a third party. ACY makes no representation or warranty and assumes no liability as to the accuracy or completeness of the information provided, nor any loss arising from any investment based on a recommendation, forecast or other information supplies by any third-party. This content is information only, and does not constitute financial, investment or other advice on which you can rely.
ACY Securities is one of Australia's fastest growing multi-asset online trading providers, offering ultra-low-cost trading, rock-solid execution, technologically superior account management and premium market analysis.
Select the categories and companies you wish to follow directly to your person rss feed.
Create Custom RSS Feed
just now
Sign up and join over 5,000 professional members who receive personalized news alerts, curated professional connections, and more for free!
Sterling steadies after political uncertainty rattled gilt markets, while EUR/USD and EUR/GBP approach key technical levels ahead of today's European session.
GBP/AUD remains trapped in a well-defined bearish trend on both the weekly and daily timeframes.
Discover the key drivers, technical levels, and central bank expectations shaping the EUR/USD trend as the ECB prepares to hold rates and markets watch for a potential breakout.
Sydney-based multi-asset broker ACY Securities has introduced PAXGUSD, a new CFD instrument that allows clients to trade tokenised gold against the US Dollar 24 hours a day, seven days a week. The instrument is available across MetaTrader 4, MetaTrader 5, and the ACY Trading Platform.
Binance has lowered its VIP 3 Wallet Assets threshold from $3 million to $1 million and will now count OTC Spot Trading Volume at a 4x multiplier toward VIP qualification, removing the previous VIP 4 cap and allowing eligible users to progress through the full tier framework up to VIP 9.
Retail futures trading leader NinjaTrader Group has appointed Mark Omens as Senior Vice President, Commercial Strategy, bringing a 25-year veteran of derivatives marketplace CME Group into a newly created role focused on exchange partnerships and enterprise growth.
Gold Price Action Forecast: Will XAU/USD Drop to $3930? Meta Description: Read our Gold price action forecast to see if XAU/USD will drop to $3930.
BitDelta Securities Financial Services LLC (“BitDelta Securities”) today announced that it has received full regulatory approval from the Capital Market Authority (“CMA”) of the United Arab Emirates under the Category 5 — Arrangement and Advice license framework (License No. 20200000439). The approval follows the firm's receipt of In-Principal Approval earlier this year and represents the successful conclusion of the CMA's full licensing process, including the satisfaction of capital requirements, governance appointments, and operational setup.
Crypto.com has received a $400 million strategic investment from Citadel Securities, valuing the firm at $20 billion. It marks the first institutional funding round in the company's history, aimed at accelerating its expansion into tokenised securities, derivatives and other asset classes.
WTI’s pullback into $79–82 is the first major test of the bullish Elliott Wave count, with buyers targeting a renewed break above $85.