
just now


Liquidity Finder Ltd is incorporated in England and Wales, company number 10610740, registered address 167-169 Great Portland Street, Fifth Floor, London W1W 5PF, United Kingdom.
Published: just now


The gold price forecast remains bearish after sellers rejected a retest of the $4,002–$4,087 zone that once supported XAUUSD. The weekly chart shows a shift from bullish to bearish market structure. On the daily chart, gold has broken below its consolidation range and trades beneath its 50-day exponential moving average (EMA).
A fresh test of $4,002–$4,087 is the main setup to watch. If gold rallies into the zone and closes back below $4,002, further selling could extend the decline toward $3,875.
Alternatively, a daily close above $4,087 would clear the entire resistance zone. If buyers defend it on a pullback, gold could recover toward $4,150, just below daily resistance.

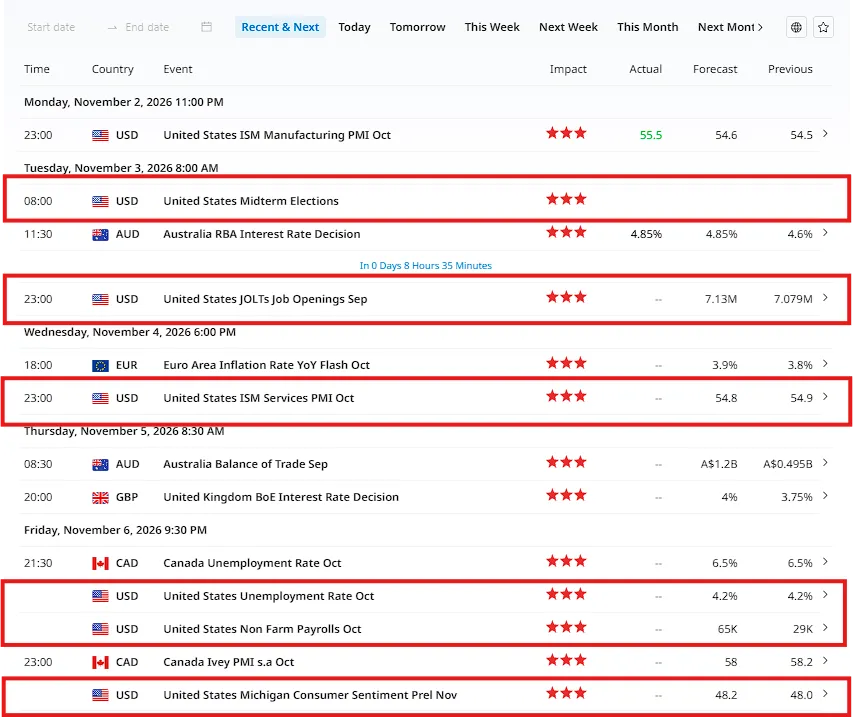
What High-impact News Could Move Gold This Week?
Source: Finlogix
U.S. jobs data, inflation reports and Fed comments can move gold by shifting interest rate expectations.
Watch $4,002–$4,087 after the news. A retest followed by a daily close below $4,002 favors further downside. A daily close above $4,087 followed by a successful retest as support favors a recovery.
Notes: This high-impact news will only serve as a catalyst for trade setups on Gold (XAU/USD).

The break below $4,002 changed the weekly structure. Buyers had previously stopped a decline inside the zone. When gold approached the same prices from below, sellers pushed it back down. That bearish candle provides the clearest evidence that former support is now acting as resistance.
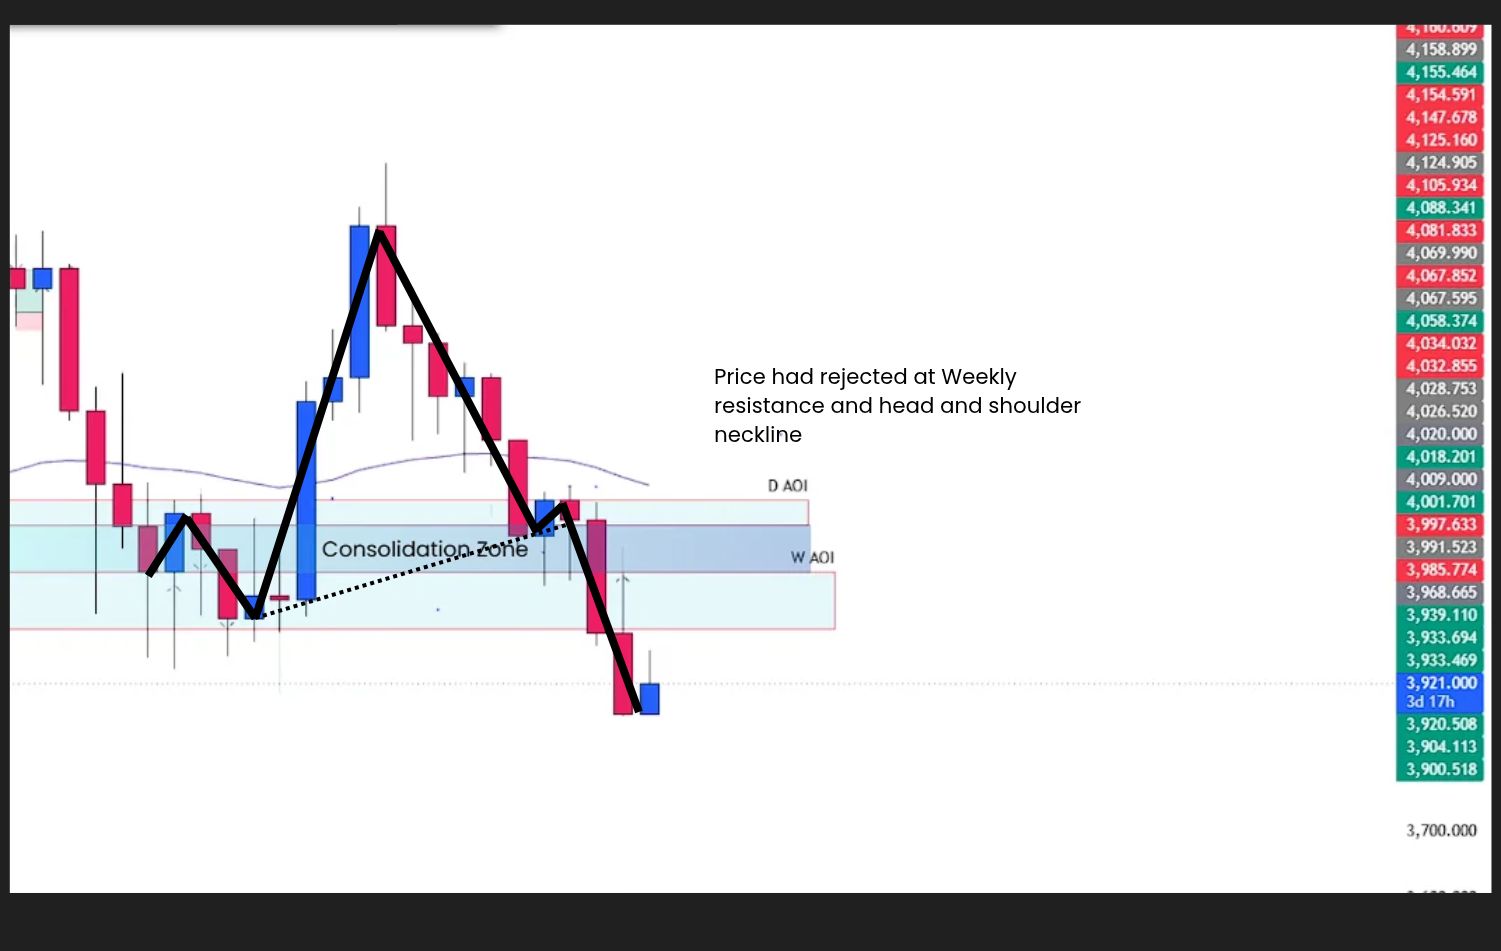
Weekly Chart Price Action Analysis: Gold retests the head-and-shoulders neckline from below after losing the $4,002–$4,087 support zone.
The retest also brought gold back to the head-and-shoulders neckline. How gold behaves there helps assess whether the pattern’s breakdown is holding. Price remains below the 50-week EMA, which could present another obstacle if gold pushes higher during the retest. How to mark gold support and resistance on a weekly chart

Daily Chart Price Action Analysis: XAUUSD breaks below consolidation and rejects weekly resistance while trading below the 50-day EMA.
Daily chart — XAUUSD breaks below consolidation and rejects weekly resistance while trading below the 50-day EMA.
Gold broke through the floor of its daily trading range. The subsequent rejection at weekly resistance shows where sellers stepped in during the retest, while the 50-day EMA remains above price. Together, those observations support the bearish weekly outlook.
Where the daily candle closes matters. For example, a retest at $4,050 would put gold back inside the zone. A close there would leave the test unresolved. A close back below $4,002 would show that sellers had pushed gold out of the zone before the session ended.
| Technical levelSignificance for XAUUSD |
| $4,002–$4,087Former weekly support zone now acting as resistance |
| $4,002Lower boundary. A close back below it after a retest supports the bearish scenario. |
| $4,087Upper boundary buyers need to clear before testing the zone as support |
| $3,875Downside target following a confirmed resistance rejection |
| $4,150Recovery target below daily resistance |
| Weekly and daily 50 EMAsTrend references and potential resistance during a retest |

Daily Timeframe Price Action Analysis: Bearish if sellers reject the $4,002–$4,087 retest and price breaks the rejection candle’s low.
The earlier rejection establishes the bearish bias. For a fresh continuation signal, watch whether buyers can hold their gains on the next rally into resistance. An upper wick followed by a bearish close below $4,002 would show that sellers defended the zone on the retest. A subsequent break of that candle’s low would add evidence that the decline has resumed. Candlestick confirmation at key levels

Daily Timeframe Price Action Analysis: Conditional Bearish Objective
A sustained recovery above $4,087, followed by a successful test of the zone as support, would weaken the bearish case.

Daily Timeframe Price Action Analysis: Bullish if gold closes above $4,087 and holds it as support on the retest.
The first test for buyers is a daily close above $4,087. The more informative test comes when gold pulls back. If sellers push price into the reclaimed zone but buyers lift the close back above its upper edge, that bullish rejection would suggest the breakout can hold. How the break-and-retest pattern works

Daily Timeframe Price Action Analysis: Conditional Bullish Objective
A daily close back below $4,002 would undermine the breakout. Even if gold reaches $4,150, that move would initially represent a recovery within the broader bearish weekly structure.
Watch which edge of $4,002–$4,087 holds after the next test. Sellers have the trend in their favor, but the $3,875 scenario still needs a failed retest and downward follow-through. Buyers have a different hurdle: clear $4,087, then defend it. That sequence would shift attention to $4,150.
_____________________________________________________________________________________
Move from learning price action to applying it in the real market.
Trade:
Access trading platforms and tools including ACY, MT4, MT5, and Copy Trading.
Create an Account and Start Live Trading
_____________________________________________________________________________________
Build your trading foundation with these step-by-step guides:
Learn to read price action and assess trading setups at key levels:
Learn to recognize bullish, bearish and sideways markets:
Learn to mark key levels and interpret price reactions:
Understand recurring price patterns, retests and false breakouts:
Learn to combine candlestick signals with price action analysis:
Learn to recognize patterns that may signal a change in market direction:
Explore how to combine the exponential moving average with price action:
Bring your technical analysis skills together through a gold swing trading guide:
Learn how risk management and position sizing fit into your trading plan:
Learn how to plan take-profit targets using market structure and risk-reward:
Develop discipline, emotional awareness and a more consistent trading process:
Explore the psychological habits behind a disciplined trading approach:
_____________________________________________________________________________________
Not sure where to begin? Here’s a simple roadmap to guide you:
By building step by step; from basics → real trading → mastering the craft, you’ll gain clarity, confidence, and steady progress without ever feeling overwhelmed.
______ _______________________________________________________________________________
Follow Ruffy Grant B. Capacio for Gold analysis, Forex trading ideas, price action education, trading psychology, and market insights: LinkedIn
ACY Securities: Join the Discord Server
Disclaimer:
Trading Forex, Gold, CFDs, cryptocurrencies, commodities, indices, and other leveraged financial instruments involves a high degree of risk and may not be suitable for all investors or traders. Market conditions can change rapidly, and leveraged trading can result in losses that occur quickly.
Before trading, carefully consider your investment objectives, level of experience, and risk tolerance. Only trade with capital you can afford to lose and seek independent financial or professional advice where appropriate.
All market analysis, price forecasts, technical commentary, trading scenarios, educational materials, and opinions presented in this content are provided solely for general informational and educational purposes. They do not constitute financial advice, investment advice, a recommendation, solicitation, or an offer to buy or sell any financial instrument.
Past performance and historical price movements are not reliable indicators of future results. Any price levels, targets, scenarios, or market outlooks discussed should be viewed as analysis rather than guarantees of future market performance. November 3, 2026
ACY Securities is one of Australia's fastest growing multi-asset online trading providers, offering ultra-low-cost trading, rock-solid execution, technologically superior account management and premium market analysis.

Select the categories and companies you wish to follow directly to your person rss feed.
Create Custom RSS FeedSign up and join over 5,000 professional members who receive personalized news alerts, curated professional connections, and more for free!
Gold faces resistance at $4,002–$4,087 after breaking weekly support. See what would confirm a decline toward $3,875 or a recovery toward $4,150.
Why did gold drop to $3,900? Learn how XAUUSD broke below $4,002 support and fell past the $3,935 downside target in the October 12 gold price forecast.
USDJPY price forecast: Analyze bearish market structure, 50 EMA resistance, key levels at 157.850–158.350, and potential targets at 156.780 and 160.000.
DAX 40 faces resistance at 25,335–25,470. Bearish rejection could bring 24,970 into focus, while a confirmed breakout could open a recovery toward 25,695.
Dubai-based financial derivatives group MultiBank Group has appointed former Crypto.com executive Mohammed Al Hakim as Vice Chairman of MultiBank Group and CEO of MB.io,
Interbank trading venue MultiBank Exchange, part of Dubai-based financial derivatives group MultiBank Group, has unveiled what it describes as the world’s first interbank trading platform to offer double exotic currency pairs with settlement in both fiat currencies and digital assets.
Multibank FX aggregation service FXSpotStream (@FXSpotStream) reported an overall average daily volume (ADV) of USD 163.217 billion for October 2026.
Eurex Clearing is to bring native digital instruments into its existing clearing framework. It says this will make it the world’s first hybrid central counterparty (CCP).
Brazil-based PropHub has secured strategic backing from Merchant Seven and private investors to expand its modular trading technology, strengthen sales and marketing, and accelerate international growth.
Devexperts hosted its first Trading Industry Leaders Lunch in Jakarta on 29 October, with more than 30 Indonesian capital markets figures discussing investor confidence, market integrity and trading infrastructure, following Bappebti approval of its flagship DXtrade multi-asset trading platform in August 2026.