just now

Liquidity Finder Ltd is incorporated in England and Wales, company number 10610740, registered address 167-169 Great Portland Street, Fifth Floor, London W1W 5PF, United Kingdom.
Published: just now


Key Takeaways:
On the weekly chart of Gold (XAU/USD), the market structure remains clearly bullish. Price continues to print higher highs and higher lows, reflecting strong and sustained upward momentum. There are also signs of a potential double bottom formation, suggesting a possible continuation of the upside trend if confirmed.
Weekly Chart Observations:
Overall, the weekly timeframe remains bullish, with price action favoring continued upward momentum.
This is what I posted on market analysis recent blogs ”Gold (XAU/USD) Price Action Idea: A High-Probability Trade Setup on Gold”.
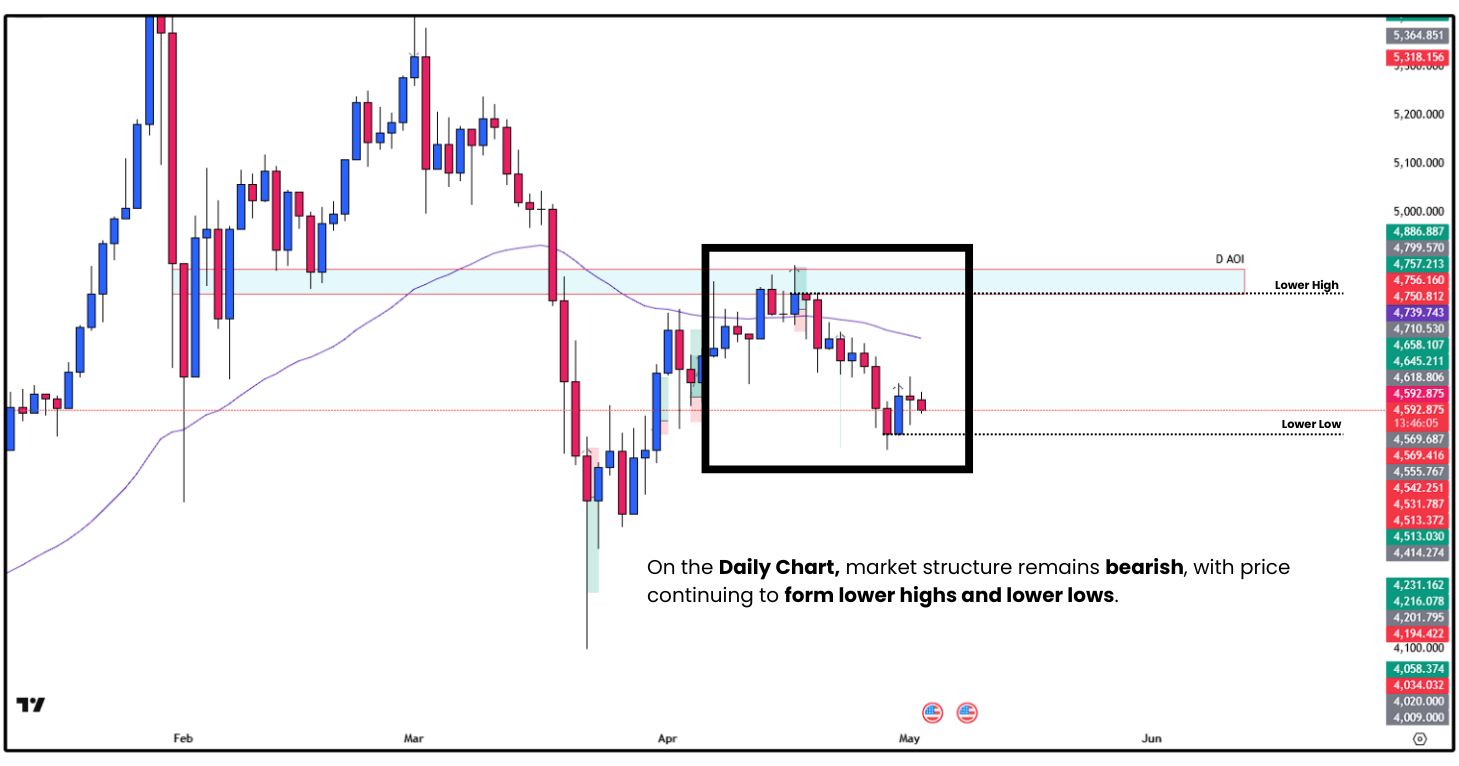
Daily Chart Observations:
In our recent blog post, “Gold (XAU/USD) Price Action Idea: A High-Probability Trade Setup on Gold?”, we discussed a potential bullish setup on Gold (XAU/USD).
Previous anticipated confirmation:
However, the market failed to confirm the expected breakout and instead maintained a bearish structure.
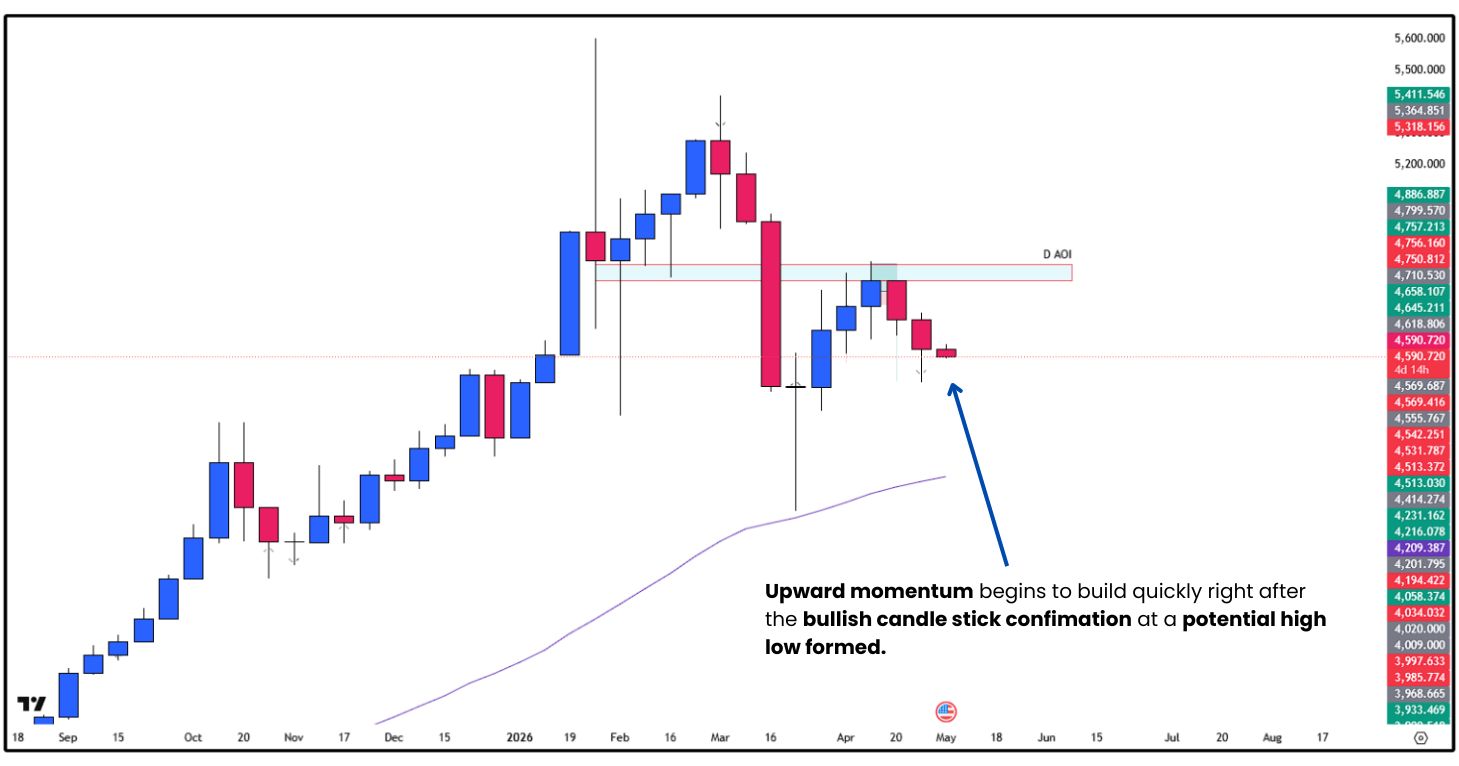
On the current price action on the daily chart, Gold still faces heavy bearish pressure across the board. However, the price is rapidly approaching a critical area where momentum could dramatically shift in our favor soon.
Daily Chart Observations:

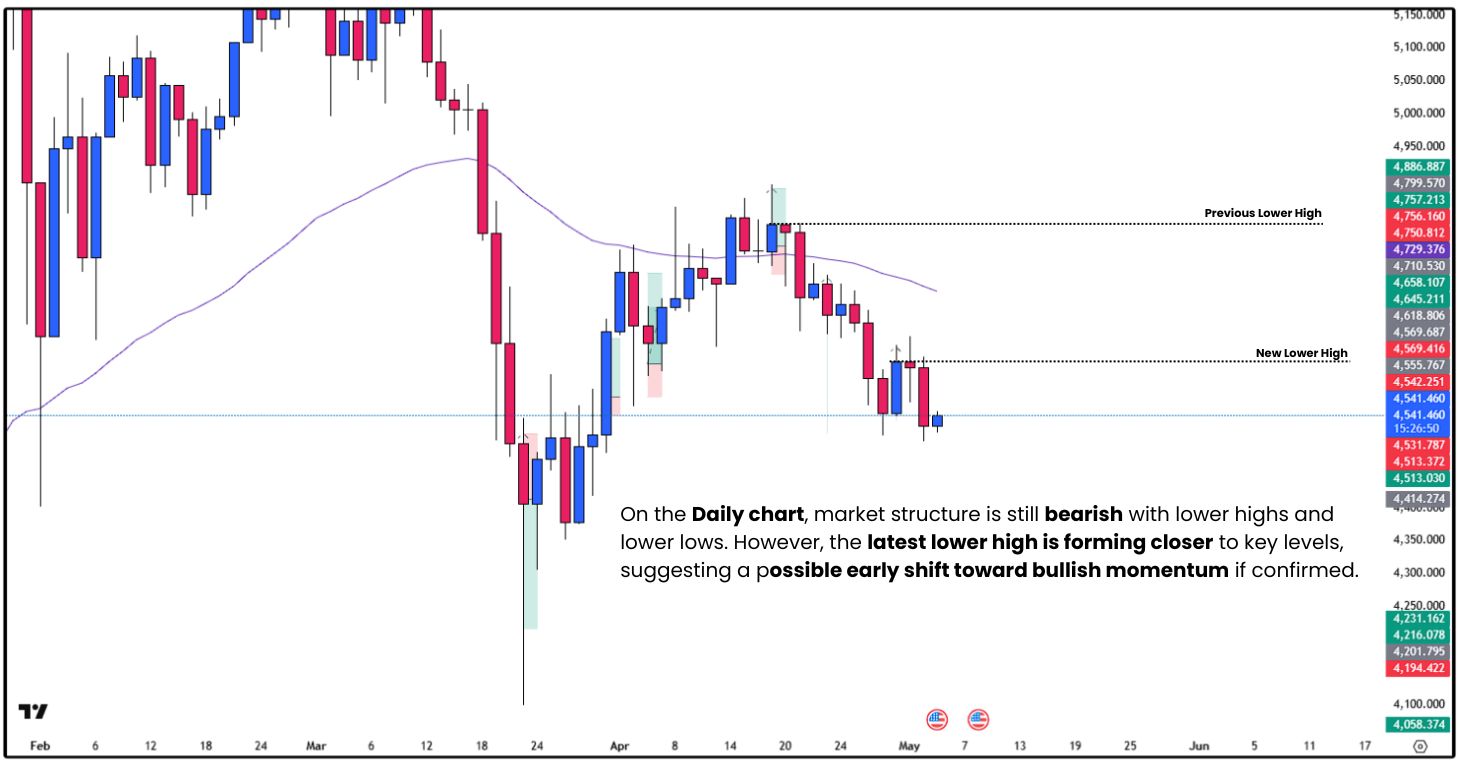
Waiting for the daily chart on Gold to turn bullish, this provides a stronger confirmation that buyers are regaining full control. Rather than forcing bad trades during weak momentum, we wait for price action to align with the higher timeframe.
This trade is considered a higher-probability setup since it aligns with the overall trend

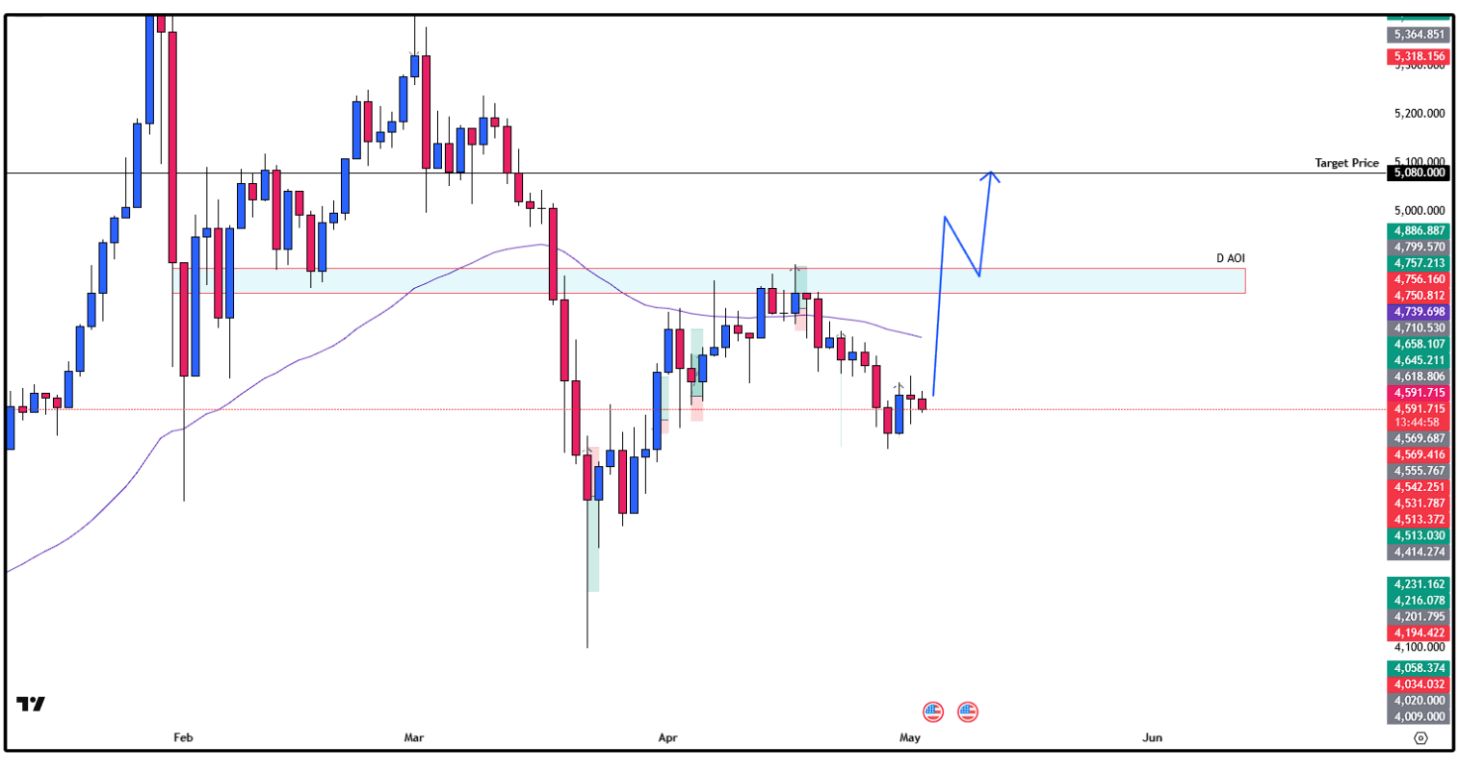
Gold XAU/USD still holds strong bullish potential on the higher timeframe, but the daily chart needs confirmation before buyers fully regain control. A clean breakout and retest of the 4650.855–4622.470 zone could open the path toward 4760.000.
In trading, patience is one of the biggest edges profitable traders use every single day.
The market will always create opportunities!
But the best setups always go to traders who wait for confirmation, stay disciplined, and let the market reveal its true direction first.
Because in the end,
It’s not about forcing the markets to move, it’s about reacting to it with precision when everything finally aligns.
For more in-depth market breakdowns, real-time analysis, and structured learning content, you can join our Discord community inside ACY Server:
Discord Server - ACY Securities Server
Start your live trading journey today!
• Trade Forex, indices, gold, crypto and other global markets
• Access powerful platforms including ACY, MT4, MT5, and Copy Trading tools
Move from learning simple price action to executing it in the real market with confidence!
Create an Account. Start Your Live Trading Now!
Ready to learn simple price action strategy? Here’s how to do it step by step:
Gold is still one of the most traded assets, here’s how to trade it with confidence:
Your mindset is what separates steady growth from costly mistakes. Focus on these essentials:
Not sure where to begin? Here’s a simple roadmap to guide you:
By building step by step; from basics → real trading → mastering the craft, you’ll gain clarity, confidence, and steady progress without ever feeling overwhelmed.
Follow me for more daily market insights!
Ruffy Grant B. Capacio - LinkedIn
Disclaimer:
Trading forex and derivative instruments involves substantial risk and may not be suitable for all individuals. Only use funds that you are prepared to lose. It is important to understand how these markets work and the risks involved before trading, and to seek independent financial advice if needed. All market analysis and insights shared are intended for educational and informational purposes only and should not be considered financial or investment advice. May 5, 2026
ACY Securities is one of Australia's fastest growing multi-asset online trading providers, offering ultra-low-cost trading, rock-solid execution, technologically superior account management and premium market analysis.
Select the categories and companies you wish to follow directly to your person rss feed.
Create Custom RSS FeedSign up and join over 5,000 professional members who receive personalized news alerts, curated professional connections, and more for free!
Retail futures trading leader NinjaTrader Group has appointed Mark Omens as Senior Vice President, Commercial Strategy, bringing a 25-year veteran of derivatives marketplace CME Group into a newly created role focused on exchange partnerships and enterprise growth.
Gold Price Action Forecast: Will XAU/USD Drop to $3930? Meta Description: Read our Gold price action forecast to see if XAU/USD will drop to $3930.
BitDelta Securities Financial Services LLC (“BitDelta Securities”) today announced that it has received full regulatory approval from the Capital Market Authority (“CMA”) of the United Arab Emirates under the Category 5 — Arrangement and Advice license framework (License No. 20200000439). The approval follows the firm's receipt of In-Principal Approval earlier this year and represents the successful conclusion of the CMA's full licensing process, including the satisfaction of capital requirements, governance appointments, and operational setup.
Crypto.com has received a $400 million strategic investment from Citadel Securities, valuing the firm at $20 billion. It marks the first institutional funding round in the company's history, aimed at accelerating its expansion into tokenised securities, derivatives and other asset classes.
WTI’s pullback into $79–82 is the first major test of the bullish Elliott Wave count, with buyers targeting a renewed break above $85.

BitDelta Securities has secured a full CMA Category 5 licence in the UAE and opened a regulated office in Business Bay, Dubai. The firm operates as an introducing broker, connecting investors with licensed international brokers across multiple asset classes, with CEO Dr. Demetrios Zamboglou commenting on the milestone.
Index volatility is asleep while single stocks fight it out underneath, credit refuses to confirm the equity rally, and a bare macro calendar hands next week to oil.
Digital assets and FX brokerage GC Exchange FZE (GCEX) has appointed Mohammed A. Mulla as a Board Member of its Dubai-based entity, part of the wider GCEX Group.
Learn what Blockchain-as-a-Service is, how it works, and why businesses are using BaaS to build blockchain applications without managing infrastructure.
CFDs vs stocks compared on leverage, ownership, costs, dividends, taxes, and risk. Learn the differences between stocks and CFDs and discover which suits your investing or trading goals.


