just now

Liquidity Finder Ltd is incorporated in England and Wales, company number 10610740, registered address 167-169 Great Portland Street, Fifth Floor, London W1W 5PF, United Kingdom.
Published: just now


Key Takeaways:
The weekly charts scream one thing, while the daily timeframe hints at a totally different story. Are we going up, or are we about to see a drop? Traders are holding their breath. I always rely on simple price action to find the real answer. Let's break down exactly what the market is telling us today.
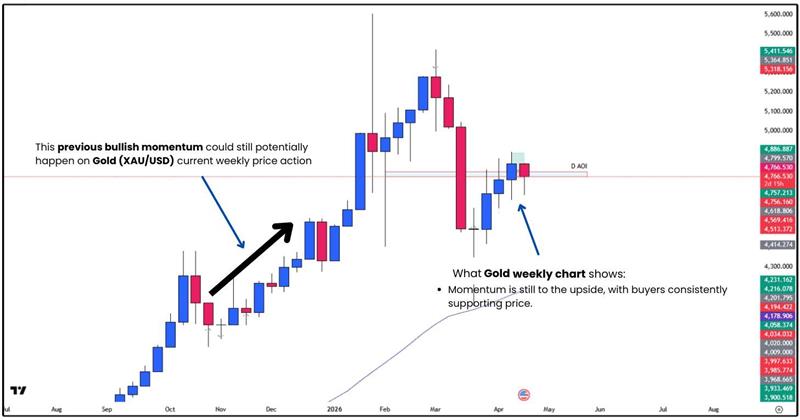
When I look at the Gold (XAU/USD) weekly chart, the overall trend is clearly bullish. Buyers are stepping up consistently. They support the price on every single dip. This tells me that gold price action still has great potential for upward movement. The bigger picture remains strong.
What the chart shows:
Simply put, gold is still in a bullish trend and continues to show potential for further upside movement.
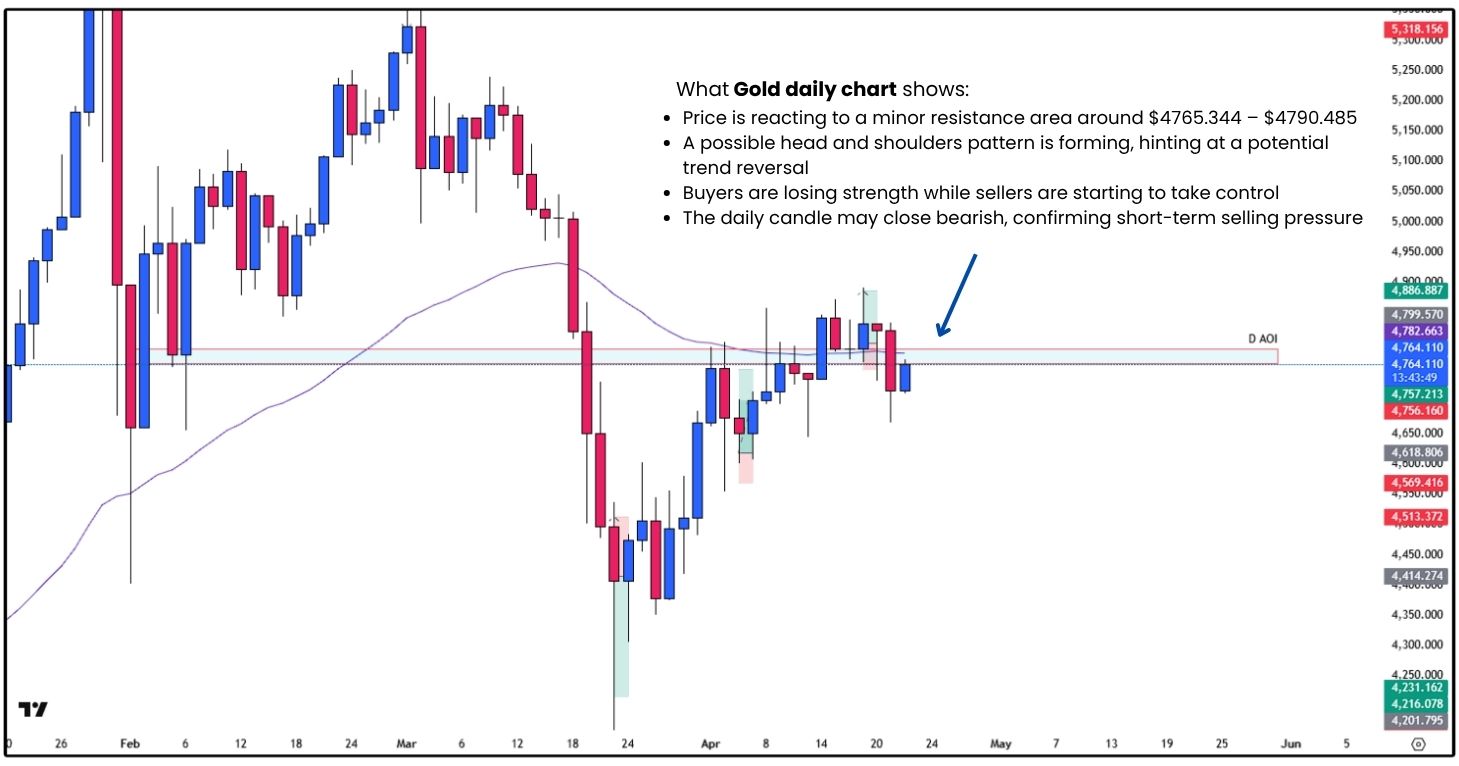
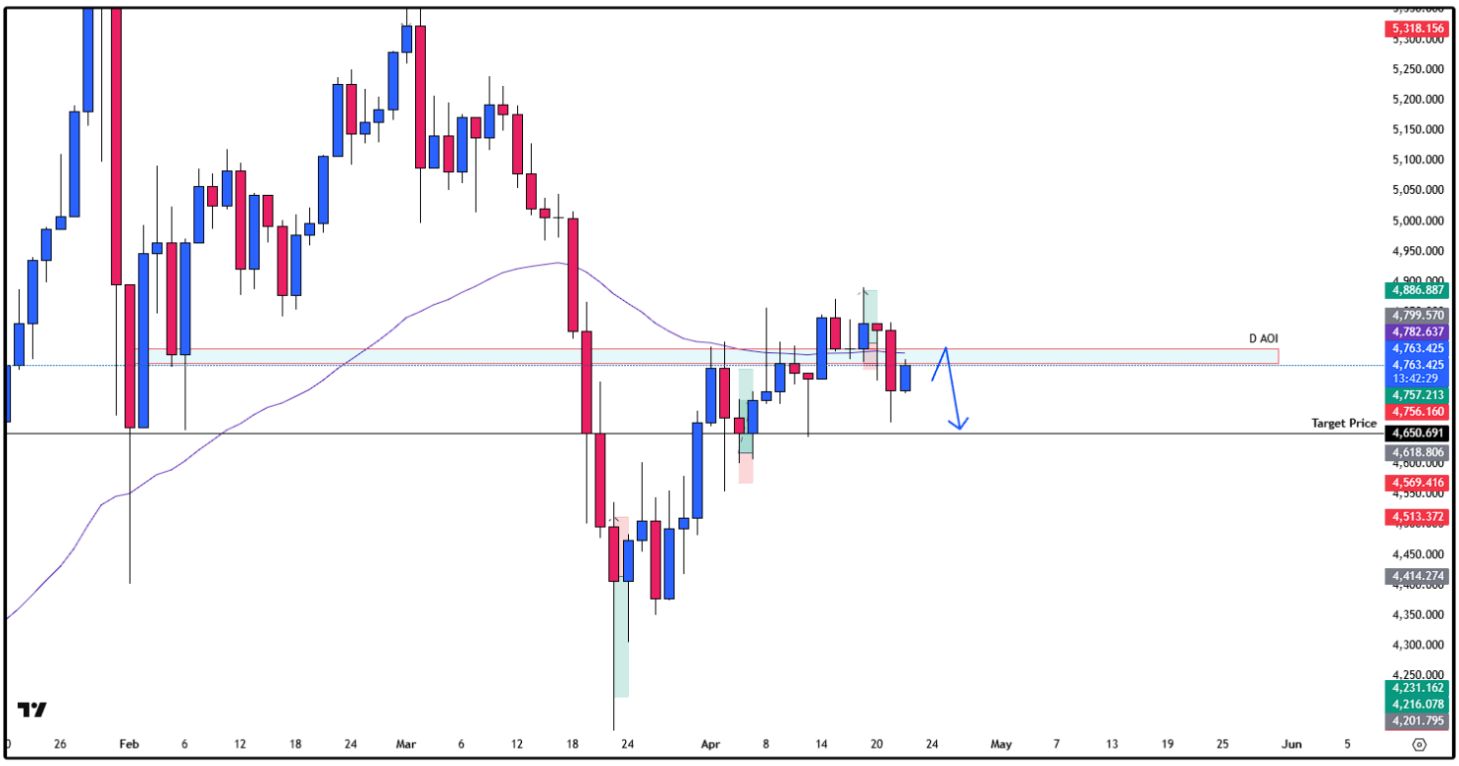
On the daily timeframe it shows a very different short-term shift of trend. It simply does not align with our higher-timeframe bullish trend. Right now, the price is reacting to a minor resistance area around $4765.344 to $4790.485.
What the chart shows:
Simply put, even though the bigger trend is still bullish, in the short-term momentum is currently turning bearish, yet we could potentially squeeze a day trade in a short-term.
If you want to spot the correct XAU/USD technical bias, you must watch your key levels. I carefully examine both the bullish and bearish scenarios before I risk any capital.
we cannot just guess.
Let's look both bullish and bearish setups.
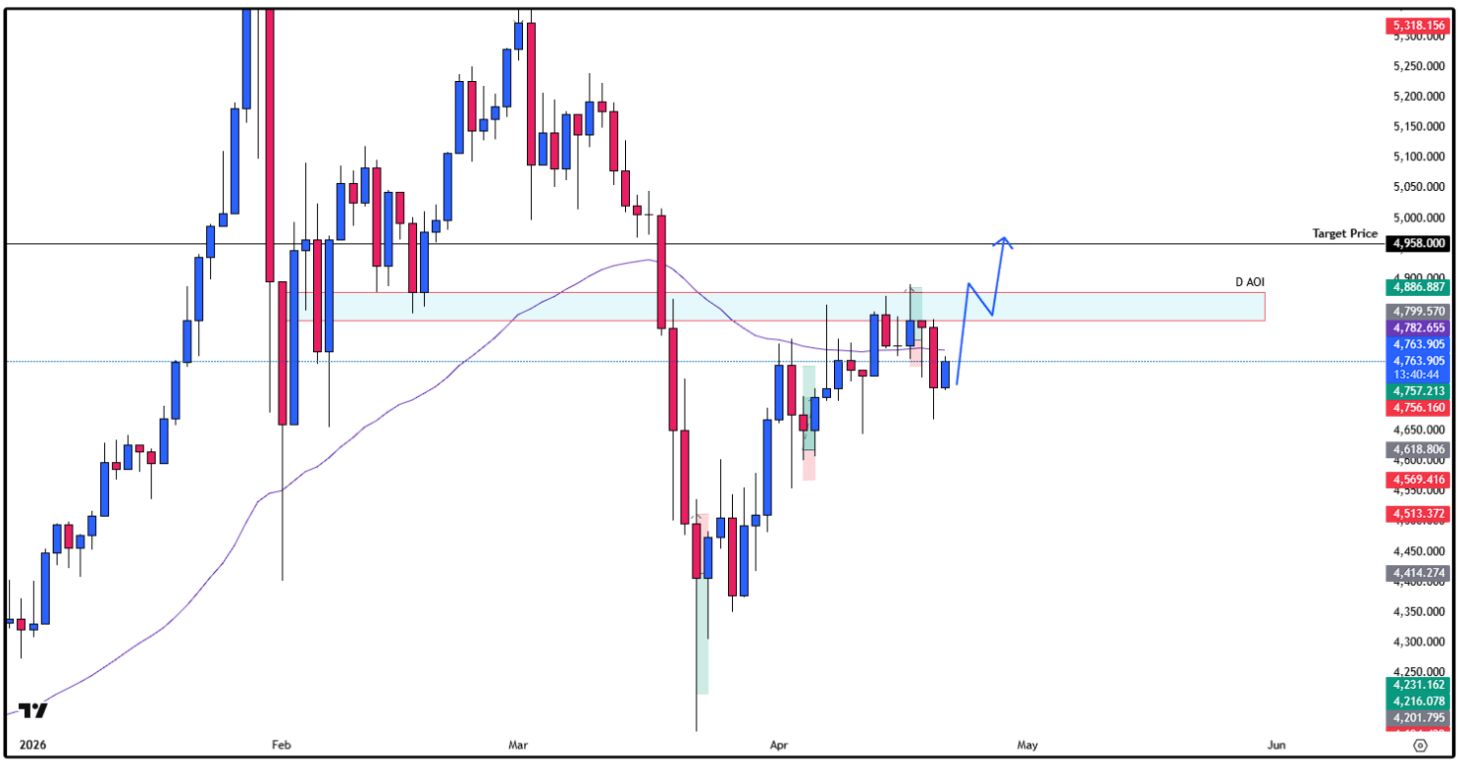
Gold remains bullish bias if:
Gold remains bearish bias if:
Note: Trading against the trend is generally much less favorable counter -trend trade generally carries lower probability and less favorable risk-to-reward conditions.

Right now, Gold is at a decision point; and this is where real traders separate themselves.
Don’t rush it. Let price come to your levels and confirm your idea. If the market shows strength at support, ride the bullish trend. If it keeps rejecting resistance, there’s room for quick shorts; but manage it tight.
You don’t need to catch every move. You just need to catch the right move!
Stay patient, stay disciplined, and trust your price action.
That’s how you grow as a trader.
For more in-depth market breakdowns, real-time analysis, and structured learning content, you can join our Discord community inside ACY Server:
Discord Server - ACY Securities Server
Start your live trading journey today!
• Trade Forex, indices, gold, crypto and other global markets
• Access powerful platforms including ACY, MT4, MT5, and Copy Trading tools
Move from learning simple price action to executing it in the real market with confidence!
Create an Account. Start Your Live Trading Now!
Ready to learn simple price action strategy? Here’s how to do it step by step:
Gold is still one of the most traded assets, here’s how to trade it with confidence:
Your mindset is what separates steady growth from costly mistakes. Focus on these essentials:
Not sure where to begin? Here’s a simple roadmap to guide you:
By building step by step; from basics → real trading → mastering the craft, you’ll gain clarity, confidence, and steady progress without ever feeling overwhelmed.
Follow me for more daily market insights!
Ruffy Grant B. Capacio - LinkedIn
Disclaimer:
Trading forex and derivative instruments involves substantial risk and may not be suitable for all individuals. Only use funds that you are prepared to lose. It is important to understand how these markets work and the risks involved before trading, and to seek independent financial advice if needed. All market analysis and insights shared are intended for educational and informational purposes only and should not be considered financial or investment advice. April 22, 2026
ACY Securities is one of Australia's fastest growing multi-asset online trading providers, offering ultra-low-cost trading, rock-solid execution, technologically superior account management and premium market analysis.
Select the categories and companies you wish to follow directly to your person rss feed.
Create Custom RSS FeedSign up and join over 5,000 professional members who receive personalized news alerts, curated professional connections, and more for free!
Binance has lowered its VIP 3 Wallet Assets threshold from $3 million to $1 million and will now count OTC Spot Trading Volume at a 4x multiplier toward VIP qualification, removing the previous VIP 4 cap and allowing eligible users to progress through the full tier framework up to VIP 9.
Retail futures trading leader NinjaTrader Group has appointed Mark Omens as Senior Vice President, Commercial Strategy, bringing a 25-year veteran of derivatives marketplace CME Group into a newly created role focused on exchange partnerships and enterprise growth.
Gold Price Action Forecast: Will XAU/USD Drop to $3930? Meta Description: Read our Gold price action forecast to see if XAU/USD will drop to $3930.
BitDelta Securities Financial Services LLC (“BitDelta Securities”) today announced that it has received full regulatory approval from the Capital Market Authority (“CMA”) of the United Arab Emirates under the Category 5 — Arrangement and Advice license framework (License No. 20200000439). The approval follows the firm's receipt of In-Principal Approval earlier this year and represents the successful conclusion of the CMA's full licensing process, including the satisfaction of capital requirements, governance appointments, and operational setup.
Crypto.com has received a $400 million strategic investment from Citadel Securities, valuing the firm at $20 billion. It marks the first institutional funding round in the company's history, aimed at accelerating its expansion into tokenised securities, derivatives and other asset classes.
WTI’s pullback into $79–82 is the first major test of the bullish Elliott Wave count, with buyers targeting a renewed break above $85.

BitDelta Securities has secured a full CMA Category 5 licence in the UAE and opened a regulated office in Business Bay, Dubai. The firm operates as an introducing broker, connecting investors with licensed international brokers across multiple asset classes, with CEO Dr. Demetrios Zamboglou commenting on the milestone.
Index volatility is asleep while single stocks fight it out underneath, credit refuses to confirm the equity rally, and a bare macro calendar hands next week to oil.
Digital assets and FX brokerage GC Exchange FZE (GCEX) has appointed Mohammed A. Mulla as a Board Member of its Dubai-based entity, part of the wider GCEX Group.
Learn what Blockchain-as-a-Service is, how it works, and why businesses are using BaaS to build blockchain applications without managing infrastructure.


