Explore Companies BySectors & Categories
Explore Companies ByUse Cases
Explore Companies ByProducts & Services
Explore Companies ByRankings & Reviews
Featured NewsCompaniesMarketsCryptoTechRegulatoryCommentaryUKUSWorldMore

    Latest Wires

      Daily Newsletter

      LF Daily News

      Daily industry focused newsletter giving you an overview for the financial & finTech industry.

      See All Newsletters
      By clicking "Sign Up" you are agreeing to our Terms of Service and Privacy Policy

      How to Trend-Trade Gold Using RSI: Why Most Traders Miss the Real Signal in Trading Gold

      Published: just now

      How to Trend-Trade Gold Using RSI: Why Most Traders Miss the Real Signal in Trading Gold
      Visual content

      Goal of This Lesson

      Visual content

      To teach you how to use the Relative Strength Index (RSI) on Gold (XAU/USD) with precision - by understanding how RSI behaves differently on Gold and using it to read momentum, macro pressure, and trend exhaustion.

      What You’ll Learn:

      • Why RSI behaves uniquely on Gold vs currency pairs
      • How to use RSI in trending vs ranging Gold markets
      • The role of Dollar and macro drivers with RSI signals
      • RSI tricks like divergence and trend filter for XAU/USD

      Most traders apply RSI on Gold like any other chart.

      But here’s the truth:

      Gold is not a typical asset. It reacts to interest rates, inflation, risk sentiment, the U.S. dollar, and most especially, in market turmoil.

      So when you treat RSI like a simple buy-sell switch on XAU/USD, you’ll often get burned.

      Let’s decode how to use RSI properly, the smart way, on Gold.

      What Is RSI?

      RSI (Relative Strength Index) is a momentum oscillator that measures how fast and strong price is moving.

      • Range: 0 to 100
      • Default setting: 14 periods
      • Interpretation:
        • Above 70 = Overbought
        • Below 30 = Oversold

      But unlike many pairs, RSI extremes on Gold don’t always mean reversal — especially when macro forces are at play.

      Common Traps When Using RSI on Gold

      Visual content
      1. Selling Just Because RSI Is Overbought
        • In Gold uptrends, RSI can stay above 70 for days.
        • You’ll often short too early while price keeps climbing.
      2. Buying Just Because RSI Is Oversold
        • In aggressive selloffs (e.g., after hawkish Fed data), RSI stays below 30 longer than expected.
      3. Ignoring the U.S. Dollar
        • Gold and the Dollar move inversely.
        • RSI may flash “overbought,” but if the Dollar is tanking, Gold can keep rising.
      4. Forgetting Macro Context
        • News like CPI, PPI, Fed announcements, and geopolitical tension can overpower RSI levels.

      There are times that Gold and Dollar converges in the same direction, the key here is so be cautious most especially, when the risk of holding Dollar is higher with potential rate-cuts, making Gold safer to hold vs the prior.

      The Right Way to Use RSI on Gold

      In a Range-Bound Gold Market

      Visual content

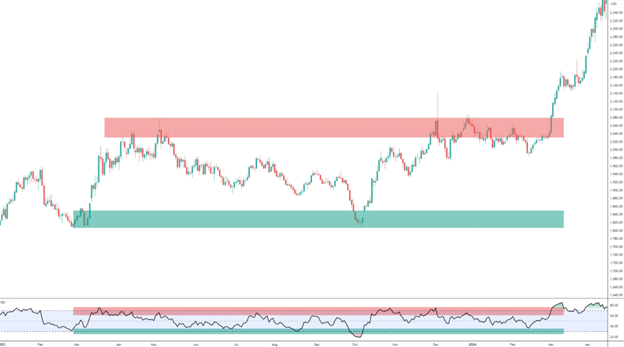
      Gold is moving sideways - no strong trend.

      • RSI > 70 = Price stretched → Look to sell
      • RSI < 30 = Price oversold → Look to buy

      Use RSI like a rubber band in choppy markets - wait for the snapback to mean.
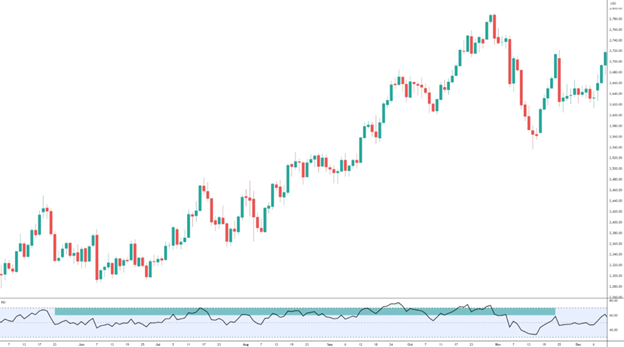
      In a Gold Uptrend

      Visual content

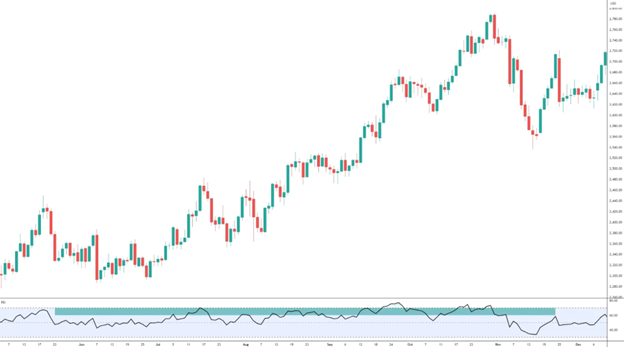
      Gold is bullish - driven by falling yields or a weak Dollar.

      • RSI > 70 = Strong momentum, not a sell
      • Wait for pullbacks where RSI dips to 40–50 zone
      • Pair with bullish structure or Fair Value Gaps (FVG)

      In bullish Gold conditions, RSI > 70 is a green light, not a stop sign.

      In a Gold Downtrend

      Visual content

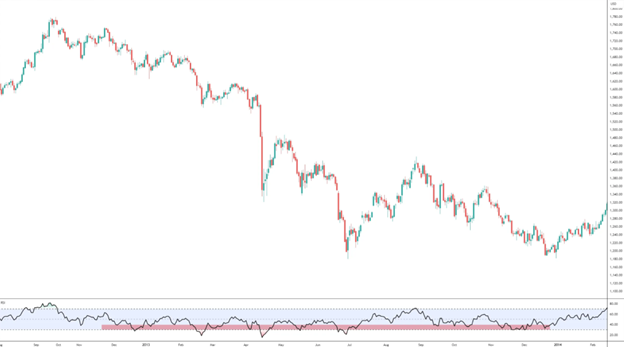
      Gold is bearish - often after strong jobs data or rising real yields.

      • RSI < 30 = Strong selling, not the bottom
      • Look to short when RSI pulls back to 50-60 zone
      • Combine with lower highs, lower lows

      RSI in a downtrend is a confirmation tool - not a reversal invitation.

      RSI as a Trend Filter on Gold

      Use RSI to confirm strength or weakness:

      • Price and RSI both making higher highs = Momentum confirmed
      • Price making higher highs, RSI flat or falling = Weakening trend (bearish divergence)
      • Price making new lows, RSI makes higher lows = Bullish divergence (potential reversal)

      Line charts work best for spotting RSI divergence clearly on XAU/USD.

      Step-by-Step RSI Trend-Following Strategy in Trading Gold Using Breakouts

      Gold likes to trend most of the time, especially during periods of macroeconomic uncertainty, falling interest rates, or Dollar weakness. That’s why RSI works best on Gold when used to confirm breakout momentum and avoid premature counter-trend trades.

      Here’s how to use RSI as a trend-following weapon in breakout conditions:

      Step 1: Identify if RSI Is Above 60 (for Bullish) or Below 40 (for Bearish)

      Visual content
      • For breakouts, look for trades above the RSI 60. RSI should be pushing above 60–70 - confirming momentum is strong.
      • For breakdowns, RSI should be falling below 40–30 - confirming sellers are in control.
      • This prevents you from buying weak breakouts or fading strong trends too early.

      Some notes to consider:

      • Avoid trading breakouts with RSI in the neutral 45–55 zone - it signals indecision.
      • Gold trends most of the time. Capitalize long trades vs short trades.

      Step 2: Identify the Breakout Levels

      Visual content
      • Mark major resistance or support levels on the 4H or Daily chart.
      • Use previous swing highs/lows, Fair Value Gaps (FVG), or consolidation ranges.
      • Wait for a clear break and close beyond that level.

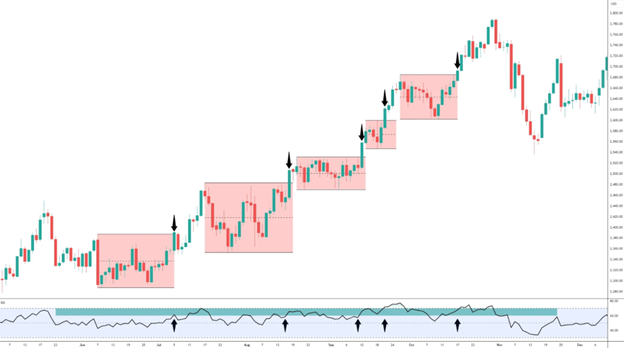
      Tip: Real breakouts often come with strong candles and volume — not just wicks.

      Step 3: Use Candlestick Confirmation or Market Structure Shift (MSS)

      • Look for bullish engulfing, MSS, or liquidity sweep + reaction to trigger your entry.
      • Keep risk tight below recent swing low/high or just beyond the FVG.

      Step 4: Let RSI Guide the Trend Health

      Visual content
      • Stay in the trade as long as RSI stays above 50 (uptrend) or below 50 (downtrend).
      • Exit partials if RSI starts showing divergence or flattening while price pushes further.
      • This helps you ride the trend, not scalp for crumbs.

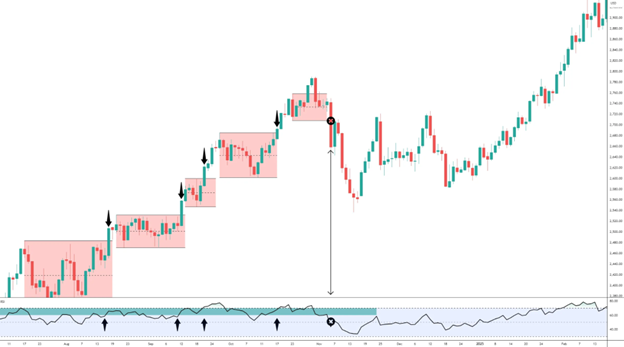
      Exit Tip: Combine RSI breakdown to 50 with range breakdown.

      What If I Exit… Then the Trend Resumes?

      This is one of the most common trader fears - and it’s valid:

      “What if I close my position because RSI showed divergence… but then Gold keeps trending?”

      The answer: You can always re-enter.

      Visual content

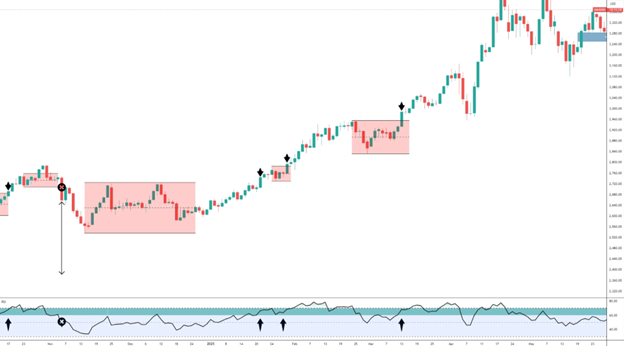
      That’s the beauty of trading with structure and RSI:

      • If RSI resets and rebuilds strength (e.g., dips to 45–50, then climbs back above 60)…
      • If price forms a new Fair Value Gap or bullish continuation pattern
      • If structure respects higher lows and the Dollar remains weak…

      Then the trend is still healthy - and you can jump back in with a new, well-defined setup.

      Don’t let FOMO ruin your edge. Missing one candle doesn’t mean missing the trend.

      “Exiting is not failure. It’s discipline. Re-entry is the professional’s move when new evidence appears.”

      The goal isn’t to catch every pip - it’s to catch the high-probability leg of the move. RSI helps you stay with strength and exit accordingly. And when the trend proves itself again… you can always re-enter with clarity, not emotion.

      So... What’s the Secret?

      The real secret to RSI on Gold?

      It’s not always about reversal - it’s about following the strength and staying on it as long as you as structures allows.

      • RSI tells you if Gold has momentum or exhaustion
      • It reflects whether price can sustain or snap
      • It works best when used with market structure, macro narrative, and confluences

      In ranges, use RSI to fade extremes

      In trends, use RSI to time entries, not exits

      Watch divergences, they whisper before the chart screams

      Final Thought

      Visual content

      “Gold respects momentum more than numbers. RSI is your compass - but only if you know where the winds are blowing.”

      This content may have been written by a third party. ACY makes no representation or warranty and assumes no liability as to the accuracy or completeness of the information provided, nor any loss arising from any investment based on a recommendation, forecast or other information supplies by any third-party. This content is information only, and does not constitute financial, investment or other advice on which you can rely.

      ACY Securities is one of Australia's fastest growing multi-asset online trading providers, offering ultra-low-cost trading, rock-solid execution, technologically superior account management and premium market analysis.

      This content may have been written by a third party. LiquidityFinder makes no representation or warranty and assumes no liability as to the accuracy or completeness of the information provided, nor any loss arising from any investment based on a recommendation, forecast or other information supplies by any third-party. This content is information only, and does not constitute financial, investment or other advice on which you can rely.
      Comments
      Most Recent
      Written By
      Daily Newsletter

      LF Daily News

      Daily industry focused newsletter giving you an overview for the financial & finTech industry.

      See All Newsletters
      By clicking "Sign Up" you are agreeing to our Terms of Service and Privacy Policy
      RSS Feeds

      Create a custom RSS Feed

      Select the categories and companies you wish to follow directly to your person rss feed.

      Create Custom RSS Feed

      Related Categories:

      Related Tags:

      #RelativeStrengthIndex#Gold#XAUUSDTrend#MomentumTrading#USDollar#MacroEconomics#TechnicalAnalysis

      Related Articles:

      Find The Right Partners for
      Your Trading Business

      Sign up and join over 5,000 professional members who receive personalized news alerts, curated professional connections, and more for free!

      Sign Up with LinkedIn
      Create Your FREE Account
      Get access to latest news, updates, real-time data, brokerage and trading firm insights and customized information feeds.

      NVDA enters tonight's $5.7T print with a stacked deck against it — the bear case needs only one leg to break, the bull case needs all three to clear elevated whispers.

      just now

      dxFeed has integrated Kalshi, a CFTC-regulated prediction market exchange, into its Event-Based Contracts Market Data Feed, offering real-time data on binary outcome markets.

      just now

      MEXC reports a sharp increase in traditional finance futures trading, with AI semiconductor assets leading the surge. The platform highlights how crypto exchanges are becoming a preferred route for users to gain exposure to TradFi markets, offering zero fees and stablecoin settlement.

      just now

      Bitget Wallet has integrated xStocks, expanding its tokenised equities and RWA offering to over 300 assets for its 90 million users. The move provides self-custodial access to tokenised stocks, ETFs, and commodities, alongside cryptocurrencies, with low fees and gasless execution.

      just now

      MARKET REPORT UK jobs data adds to GBP uncertainty ahead of tomorrow's CPI To talk to us about your next trade, call 020 7778 7500 or hit the button below Email us &nbsp; USD falls for the first time…

      Image for UK jobs data adds to GBP uncertainty ahead of tomorrow's CPI
      just now

      Market drivers and catalysts Equities: &nbsp;US stocks were mixed, Europe rose on energy and de-escalation hopes, while Asia struggled with oil and yields. Volatility: &nbsp;VIX eases, bond yields ele…

      Image for Market Quick Take – 19 May 2026
      just now

      LiquidityMatch LLC, the parent company of FXSpotStream, has launched RateStream LLC, a dedicated streaming solution for the Fixed Income markets that applies the commercial model that transformed FX trading over the past decade to one of the largest and most actively traded markets in the world.

      just now

      This is a breakdown how the market is being driven by a collision between human psychology, institutional trading traps, and macroeconomic reality.

      just now

      Yes, a cloud-based trade copier can be significantly more flexible than a traditional VPS-based setup, especially for traders or signal providers managing multiple accounts across different platforms.…

      Image for How does a modern, cloud-based trade copier differ from traditional VPS-based trade copiers?
      just now

      FOMC minutes, PMI data, drone strikes in the Gulf — May 2026 is not as calm as it looks. What broker dealing desks should be watching this week, and why the brokers who survived April had one thing in common.

      just now

      Abu Dhabi Global Market (ADGM) announced a robust start to 2026, with Assets Under Management (AUM) growing by 57% and active licences surpassing 13,000. The international financial centre continues to attract global asset managers and financial institutions, reinforcing its status as a leading hub in the MEASA region.

      just now

      EUR/USD could be gearing up for a major breakout toward 1.20 as stagflation risks, Fed policy shifts, and a bullish flag pattern align in the FX market.

      just now

      Discover the latest Gold XAU/USD trade ideas. Will the upcoming FOMC Minutes trigger a breakout or just more sideways action?

      just now

      Market drivers and catalysts Equities:&nbsp; US and European stocks fell as yields and oil rose, Asia weakened, with Korea’s chip rally hitting a wall. Currencies: &nbsp;The US dollar rallies broadly…

      Image for Market Quick Take – 18 May 2026
      just now

      MARKET REPORT Sterling suffers worst week since November 2024 as political crisis deepens To talk to us about your next trade, call 020 7778 7500 or hit the button below Email us &nbsp; USD delivers i…

      Image for Sterling suffers worst week since November 2024 as political crisis deepens
      just now

      🇸🇬 Singapore doesn't do noise. Finance Magnates Singapore Summit 2026 was exactly that — concentrated, serious, and the kind of room where every conversation counts. The APAC market is a different b…

      just now

      For years, self-managed super funds (SMSFs) have been heavily invested in shares, property, and cash. However, that is now changing as a growing number of Australian retirement investors are adding Bi…

      Image for Bitcoin in SMSFs: Why Australian Retirement Investors Are Allocating to Crypto in 2026
      just now

      Upcomers, a fast-growing prop trading firm, has partnered with cTrader to bring its clients a premium trading platform shaped around the way traders of all experience levels think, act and grow.&nbsp;…

      Image for Upcomers adds cTrader to foster a transparent trading environment and help traders succeed
      just now

      MARKET REPORT UK political uncertainty builds as USD extends gains To talk to us about your next trade, call 020 7778 7500 or hit the button below Email us &nbsp; USD extends its winning streak to fou…

      Image for UK political uncertainty builds as USD extends gains
      just now

      Markets are ending the week in full euphoria mode. The S&amp;P 500 and Nasdaq hit fresh record highs as investors continue piling into AI stocks despite rising inflation, surging bond yields and escal…

      just now
      Feed