just now
Liquidity Finder Ltd is incorporated in England and Wales, company number 10610740, registered address 167-169 Great Portland Street, Fifth Floor, London W1W 5PF, United Kingdom.
Published: just now
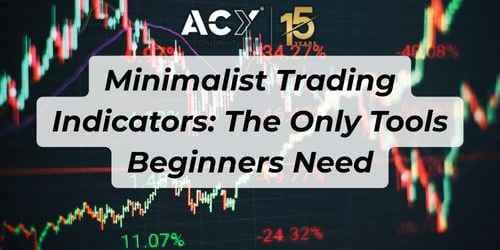
Most beginners think trading becomes easier when you add more tools - more indicators, more lines, more oscillators, more signals.
But every consistently profitable trader eventually arrives at the opposite truth:
Simplicity isn’t a limitation. It’s an edge.
When your chart is clean, your brain is clear.
When your tools are minimal, your decisions are precise.
When your system is focused, your execution becomes consistent.
This module builds on your earlier foundations - learning the basics through “Introduction to Trading: What Beginners Must Understand”, choosing your market through “Choosing Your Trading Market: Forex, Gold, or Indices”, learning the price language through “Understanding Market Structure (The Language of Price)”, and selecting your primary setup through “Beginner Trading Strategy: How to Choose One Setup and Commit”.
Now, we answer the next critical question:
Which tools should actually be on your chart - and which ones should you eliminate completely?
This feature walks you through the real toolkit used by professionals, the ones that help you focus instead of confuse you. By the end, you’ll understand exactly how to build a clean, reliable visual system that aligns with your chosen strategy.
Most beginners approach indicators the wrong way.
They treat tools like shortcuts.
“If I just find the right indicator, I won’t have to think.”
“If this one flashes BUY/SELL, it must be reliable.”
“If someone with a million views uses it, I should too.”
But trading doesn’t work like that.
Indicators are interpretive tools, not predictive tools.
They translate price.
They don’t override price.
This is why guides such as “Learn Trading From Scratch: Clean, Simple, Zero-Noise” emphasize building your foundation around market structure first, not indicators.
You don’t use tools to replace thinking.
You use tools to support reasoning.
And that’s where a minimalist approach becomes powerful.
A minimalist toolkit is not “no indicators.”
It means:
It means your chart reflects one idea:
“Here’s what the market is doing, and here’s how I’m responding.”
Your tools must help you interpret:
Nothing more.
And the simplest way to achieve that is by choosing one primary lens and one confluence tool, based on the strategy you selected earlier through resources like “Forex Trading Strategy for Beginners” or “Complete Step-by-Step Guide to Day Trading Gold”.
Below are six tool categories that actually matter.
Each one connects directly to specific ACY resources that help reinforce use-cases, context, and best practices.
Think of this list as a professional menu -
you choose what aligns with your strategy, timing, and personality.
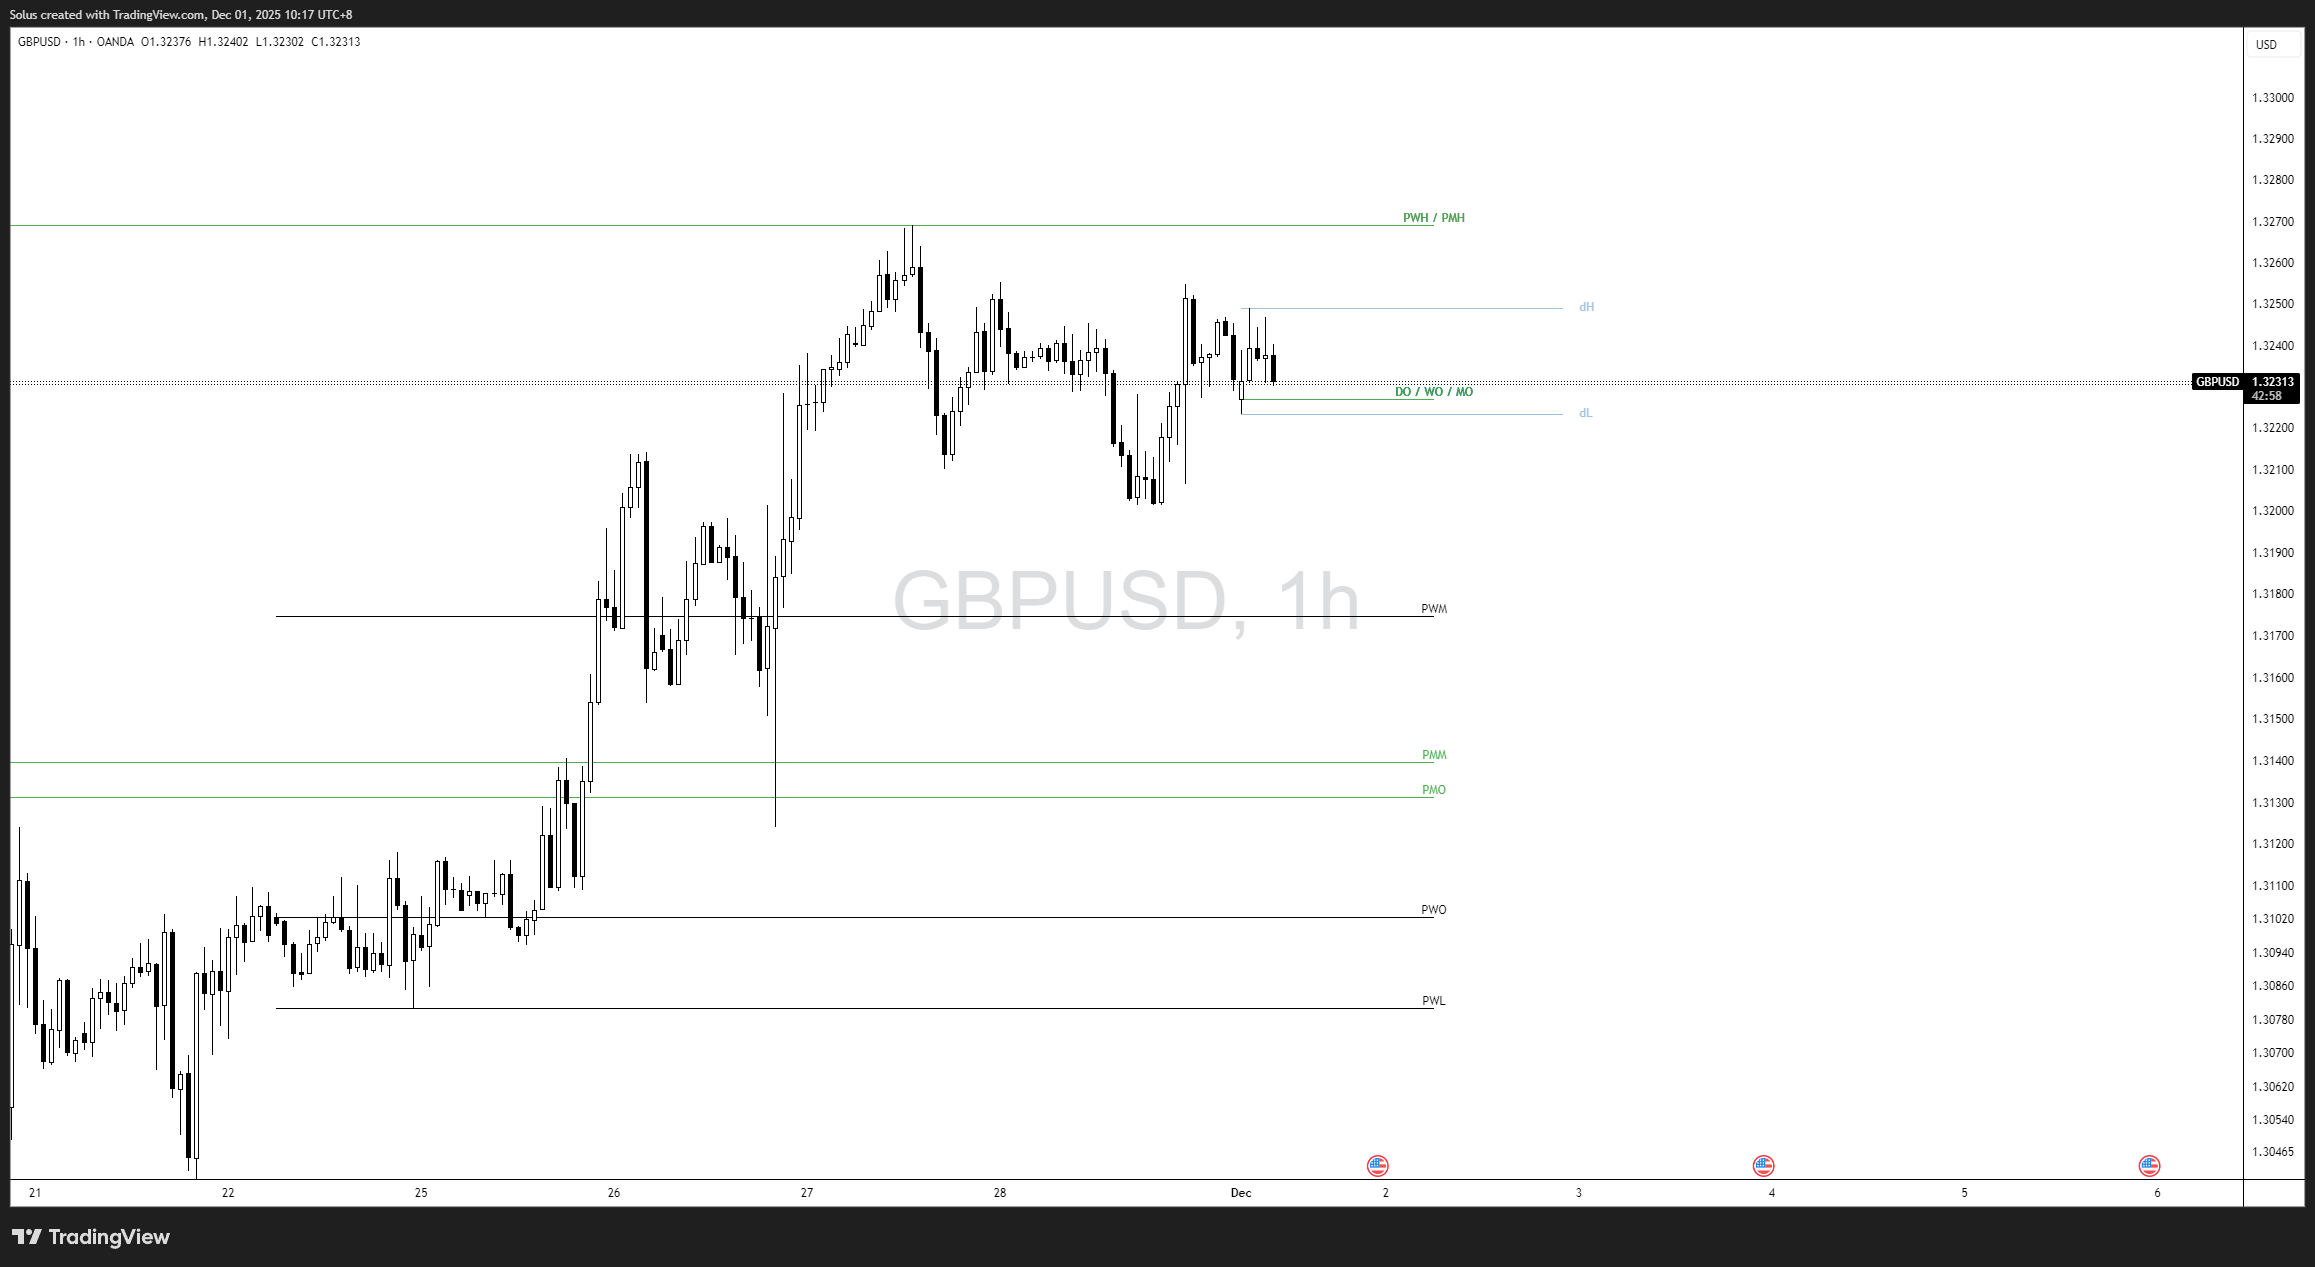
The backbone of all professional trading
Before any indicator exists, price exists.
Swings.
Levels.
Breakouts.
Rejections.
Trends and consolidations.
This approach is the purest form of market reading.
It’s also the most transferable, since it underpins advanced strategies like SMC, liquidity concepts, and institutional order flow.
Your strongest resources here include:
The idea is simple:
On a minimalist chart, this can mean:
This is the closest thing to trading with “pure vision.”
The simplest, cleanest way to track trend and structure
If pure key levels feel too naked, moving averages are a perfect complement.
They help you quickly identify:
Your full playbook for this lens is found in:
A popular minimalist combination:
Nothing more.
If your strategy revolves around:
…moving averages give clarity without clutter.
They were built for clean strategies such as:
Structured targets, structured stops, structured decisions
Fibonacci is not astrology.
It’s a framework - a structured way of mapping:
The power of Fibonacci is explained in:
Minimalist Fibonacci setups typically use:
Fibonacci excels in systems like:
This tool is for traders who want structure built into every trade.
The “micro-lens” that sharpens your execution
Candlesticks give you entry clarity:
But they only work at important locations in the structure.
Your strongest resources for candle mastery include:
Minimalist use-case:
Candles are not your strategy.
They’re your timing tool.
Confluence, not crutch
Oscillators are some of the most abused tools in trading.
Used incorrectly → false comfort
Used correctly → precision timing
Choose one:
Your detailed guides include:
Minimalist use-case:
Never trade oscillators in isolation.
Use them as confirmation only.
The invisible indicators that actually protect you
Some of the most powerful tools in trading don’t appear on your chart:
Your deepest guidance comes from:
These tools shape:
No chart tool can protect you from reckless risk-taking.
Risk tools can.
To stay consistent:
If you can’t explain an indicator’s purpose in one sentence, delete it.
The goal of this module isn’t minimalism for aesthetics.
It’s minimalism for performance.
A chaotic chart leads to chaotic trades.
A clean chart leads to clean decisions.
When you combine:
…you create the foundation for consistent execution.
This is how professionals trade.
This is how beginners progress.
This is how your chosen strategy becomes repeatable.
The tools don’t make you profitable.
But the right tools make profitability possible.
Choose your lens.
Choose your confluence.
Remove everything else.
Your next level starts with clarity -
and clarity begins with the chart in front of you.
Not necessarily. Many traders build their entire edge using nothing but price action, key levels, and timing. Indicators like moving averages, RSI, or Stochastics can help clarify structure or timing, but they should support your decisions - never replace them. If you can trade clean charts confidently, indicators simply enhance precision.
There is no universal “best” indicator, but the simplest and most beginner-friendly is the moving average because it immediately shows trend direction, momentum, and dynamic support/resistance without overloading the chart. It pairs well with price-action guides like the Moving Averages Trading Strategy Playbook.
Yes - but with limits. A minimalist chart should use one core lens (price action, moving averages, or Fibonacci) and one confluence tool (RSI, Stochastics, or candlesticks). When you stack too many, you create conflicting signals and hesitation. Your goal is clarity, not complexity.
Because indicators lag. They are visual translations of past price, not predictions of where the market will go. Professionals rely on structure, levels, momentum, order flow, and execution timing, then use indicators sparingly to enhance edge - not to guess.
A simple test:
If you cannot explain your trade idea in less than one paragraph, remove tools until you can. Your chart should show - at a glance - trend direction, key levels, entry criteria, and risk placement. Anything that distracts from those essentials is noise.
It’s time to go from theory to execution!
Create an Account. Start Your Live Trading Now!
Looking for step-by-step approaches you can plug straight into the charts? Start here:
Sharpen your edge with proven tools and frameworks:
News moves markets fast. Learn how to keep pace with SMC-based playbooks:
From NASDAQ opens to DAX trends, here’s how to approach indices like a pro:
Gold remains one of the most traded assets - here’s how to approach it with confidence:
Candlesticks are the building blocks of price action. Master the most powerful ones:
Ready to go intraday? Here’s how to build consistency step by step:
Markets swing between calm and chaos. Learn to read risk-on vs risk-off like a pro:
Step inside the playbook of institutional traders with SMC concepts explained:
Forex pairs aren’t created equal - some are stable, some are volatile, others tied to commodities or sessions.
If you’ve ever been stopped out right before the market reverses - this is why:
Mindset is the deciding factor between growth and blowups. Explore these essentials:
The real edge in trading isn’t strategy - it’s how you protect your capital:
If you’re not sure where to start, follow this roadmap:
This way, you’ll grow from foundation → application → mastery, instead of jumping around randomly.
Follow me for more daily market insights!
Jasper Osita - LinkedIn - FXStreet - YouTube
This content may have been written by a third party. ACY makes no representation or warranty and assumes no liability as to the accuracy or completeness of the information provided, nor any loss arising from any investment based on a recommendation, forecast or other information supplies by any third-party. This content is information only, and does not constitute financial, investment or other advice on which you can rely.
ACY Securities is one of Australia's fastest growing multi-asset online trading providers, offering ultra-low-cost trading, rock-solid execution, technologically superior account management and premium market analysis.
Select the categories and companies you wish to follow directly to your person rss feed.
Create Custom RSS FeedSign up and join over 5,000 professional members who receive personalized news alerts, curated professional connections, and more for free!
Retail futures trading leader NinjaTrader Group has appointed Mark Omens as Senior Vice President, Commercial Strategy, bringing a 25-year veteran of derivatives marketplace CME Group into a newly created role focused on exchange partnerships and enterprise growth.
Gold Price Action Forecast: Will XAU/USD Drop to $3930? Meta Description: Read our Gold price action forecast to see if XAU/USD will drop to $3930.
BitDelta Securities Financial Services LLC (“BitDelta Securities”) today announced that it has received full regulatory approval from the Capital Market Authority (“CMA”) of the United Arab Emirates under the Category 5 — Arrangement and Advice license framework (License No. 20200000439). The approval follows the firm's receipt of In-Principal Approval earlier this year and represents the successful conclusion of the CMA's full licensing process, including the satisfaction of capital requirements, governance appointments, and operational setup.
Crypto.com has received a $400 million strategic investment from Citadel Securities, valuing the firm at $20 billion. It marks the first institutional funding round in the company's history, aimed at accelerating its expansion into tokenised securities, derivatives and other asset classes.
WTI’s pullback into $79–82 is the first major test of the bullish Elliott Wave count, with buyers targeting a renewed break above $85.

BitDelta Securities has secured a full CMA Category 5 licence in the UAE and opened a regulated office in Business Bay, Dubai. The firm operates as an introducing broker, connecting investors with licensed international brokers across multiple asset classes, with CEO Dr. Demetrios Zamboglou commenting on the milestone.
Index volatility is asleep while single stocks fight it out underneath, credit refuses to confirm the equity rally, and a bare macro calendar hands next week to oil.
Digital assets and FX brokerage GC Exchange FZE (GCEX) has appointed Mohammed A. Mulla as a Board Member of its Dubai-based entity, part of the wider GCEX Group.
Learn what Blockchain-as-a-Service is, how it works, and why businesses are using BaaS to build blockchain applications without managing infrastructure.
CFDs vs stocks compared on leverage, ownership, costs, dividends, taxes, and risk. Learn the differences between stocks and CFDs and discover which suits your investing or trading goals.