just now

Liquidity Finder Ltd is incorporated in England and Wales, company number 10610740, registered address 167-169 Great Portland Street, Fifth Floor, London W1W 5PF, United Kingdom.
Published: just now

To help you identify potential bounce zones using moving averages across different timeframes — combining structure, momentum, and timing to execute high-probability pullback trades with clarity.

Imagine dropping a rubber ball.
In trading, moving averages act like the floor — but price only bounces when there’s enough momentum underneath. Not every touch leads to a trade. But when that bounce happens at the right place, at the right time, with structure to support it — that’s when you strike.
A common mistake: thinking price will bounce just because it touches a moving average.
But moving averages are reaction zones, not just trade signals. The high probability edge comes from combining:
When all three align, you’re no longer trading guesses — you’re trading evidence.
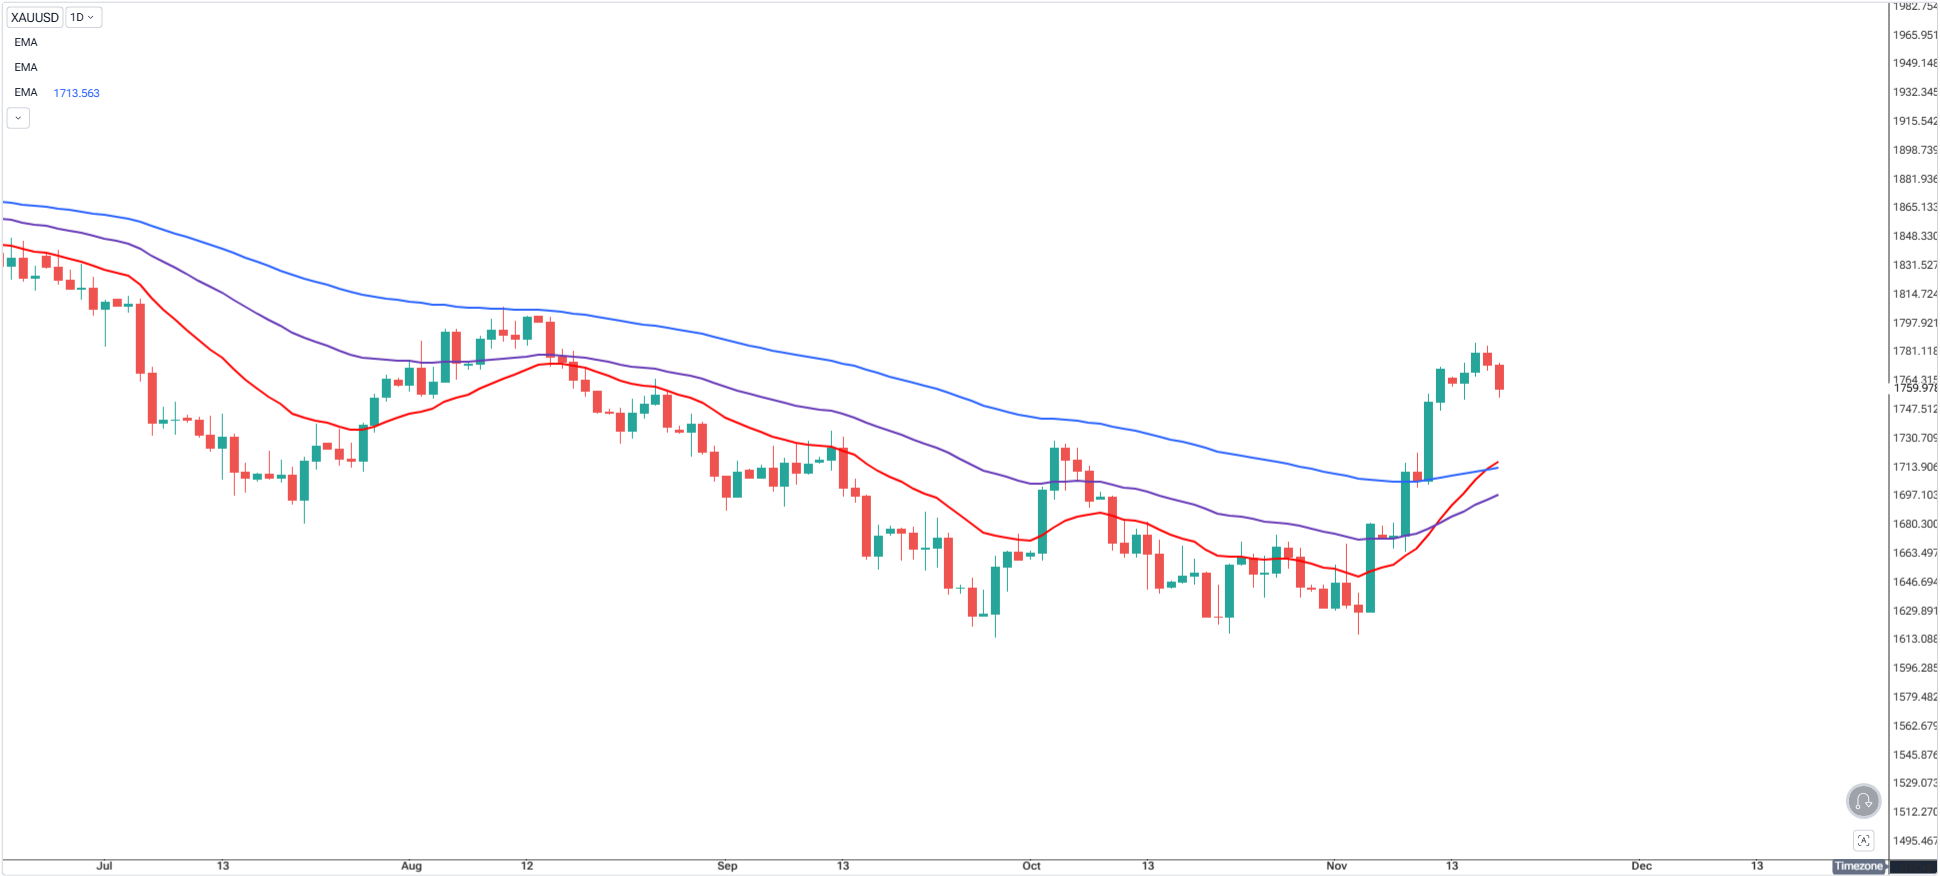
Use a 100 EMA or 200 SMA to spot the broader direction.
Let this timeframe be your trend anchor — not for entries, but for directional bias.
In this example, we are using the 20-50-100 Moving Averages on the Daily Timeframe.
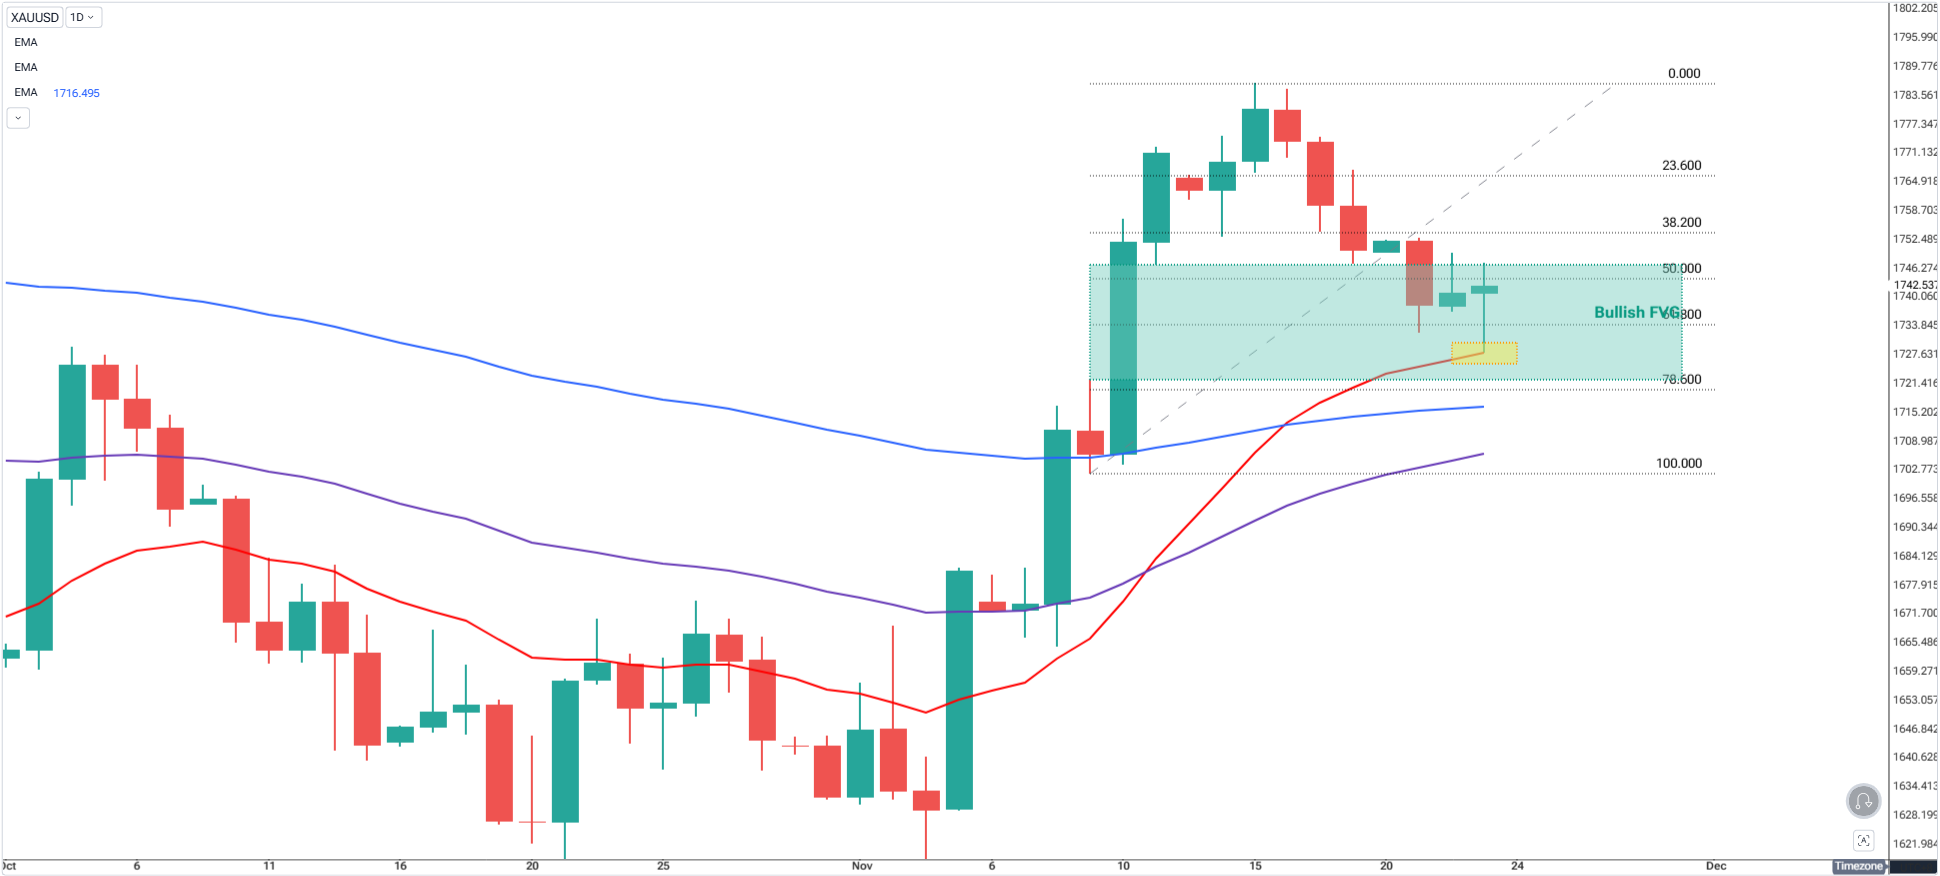
Zoom in to find where price might retrace and bounce.
Use:
Bonus: Look for confluence with:
You’re not taking trades here yet — just marking potential bounce areas where trend and pullback meet.
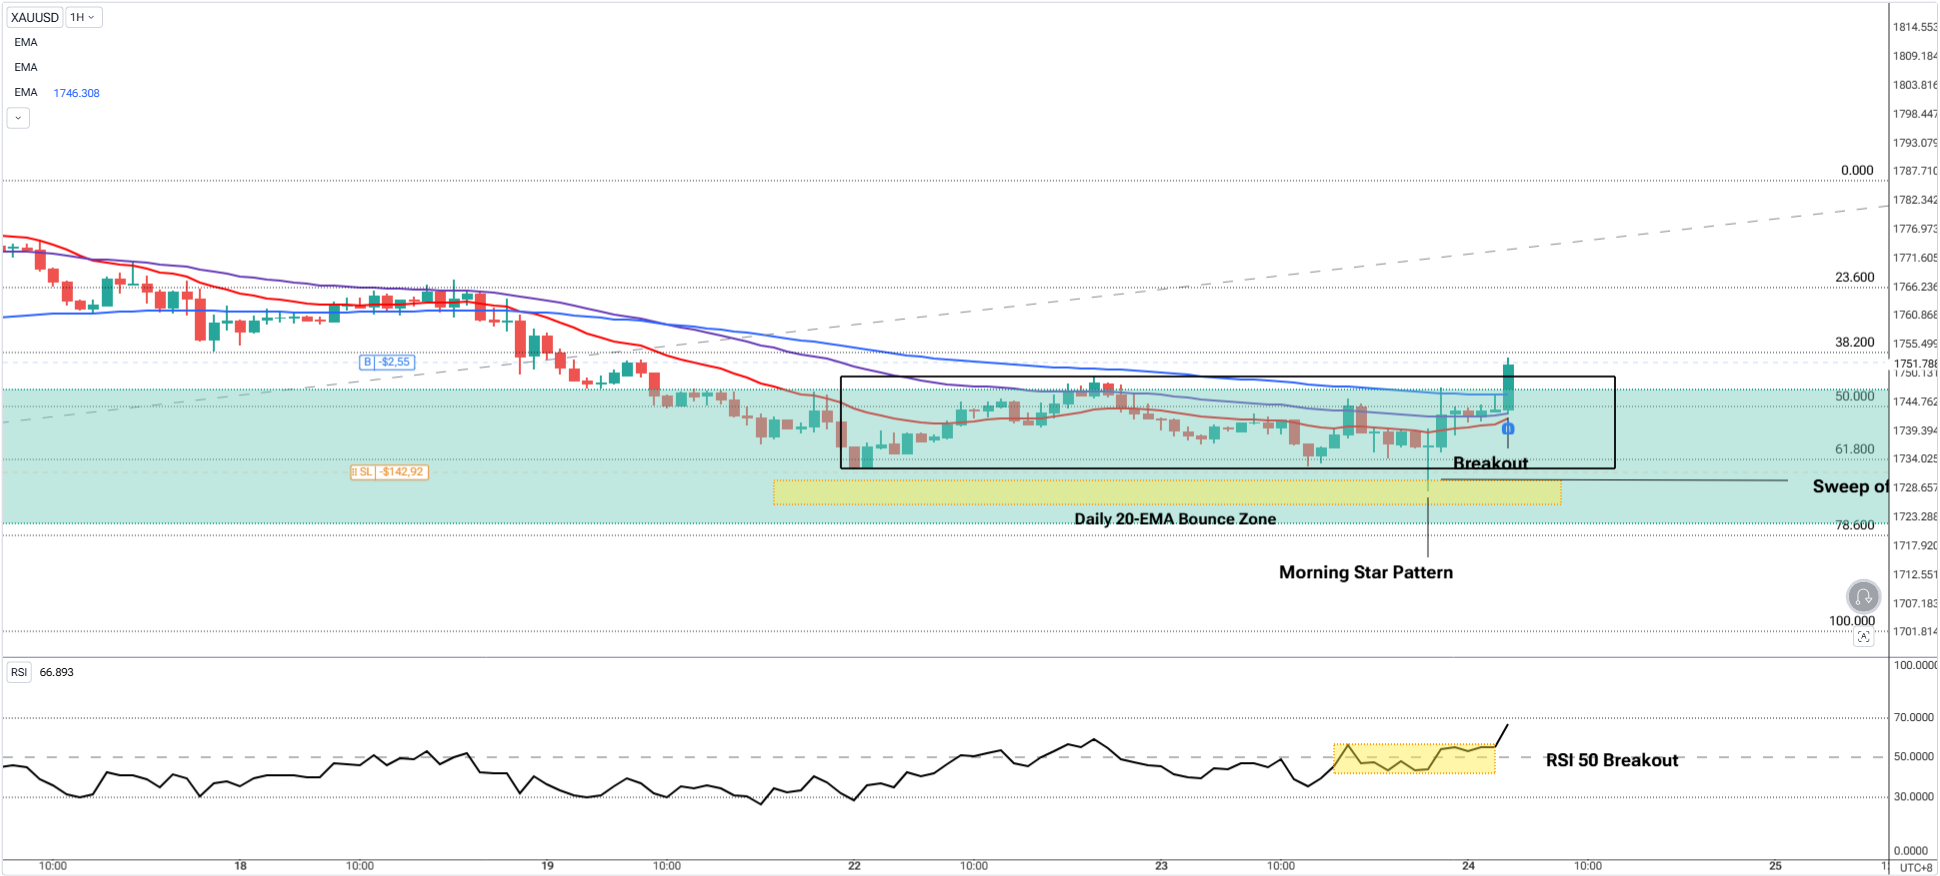
Now drop to a lower timeframe to confirm whether the bounce is real. For this example, we use the 1-hour timeframe for confirmation.
Look for:
These signs show an intention to continue the trend, not just a random reaction.
When this aligns with your MA zones above, the probability shifts in your favor.
Once you’ve executed your trade from the lower timeframe confirmation, it’s time to shift your attention to the higher timeframe to manage the trade effectively.
This is where many traders lose out — they focus only on the entry, but miss the bigger picture that holds the real potential.
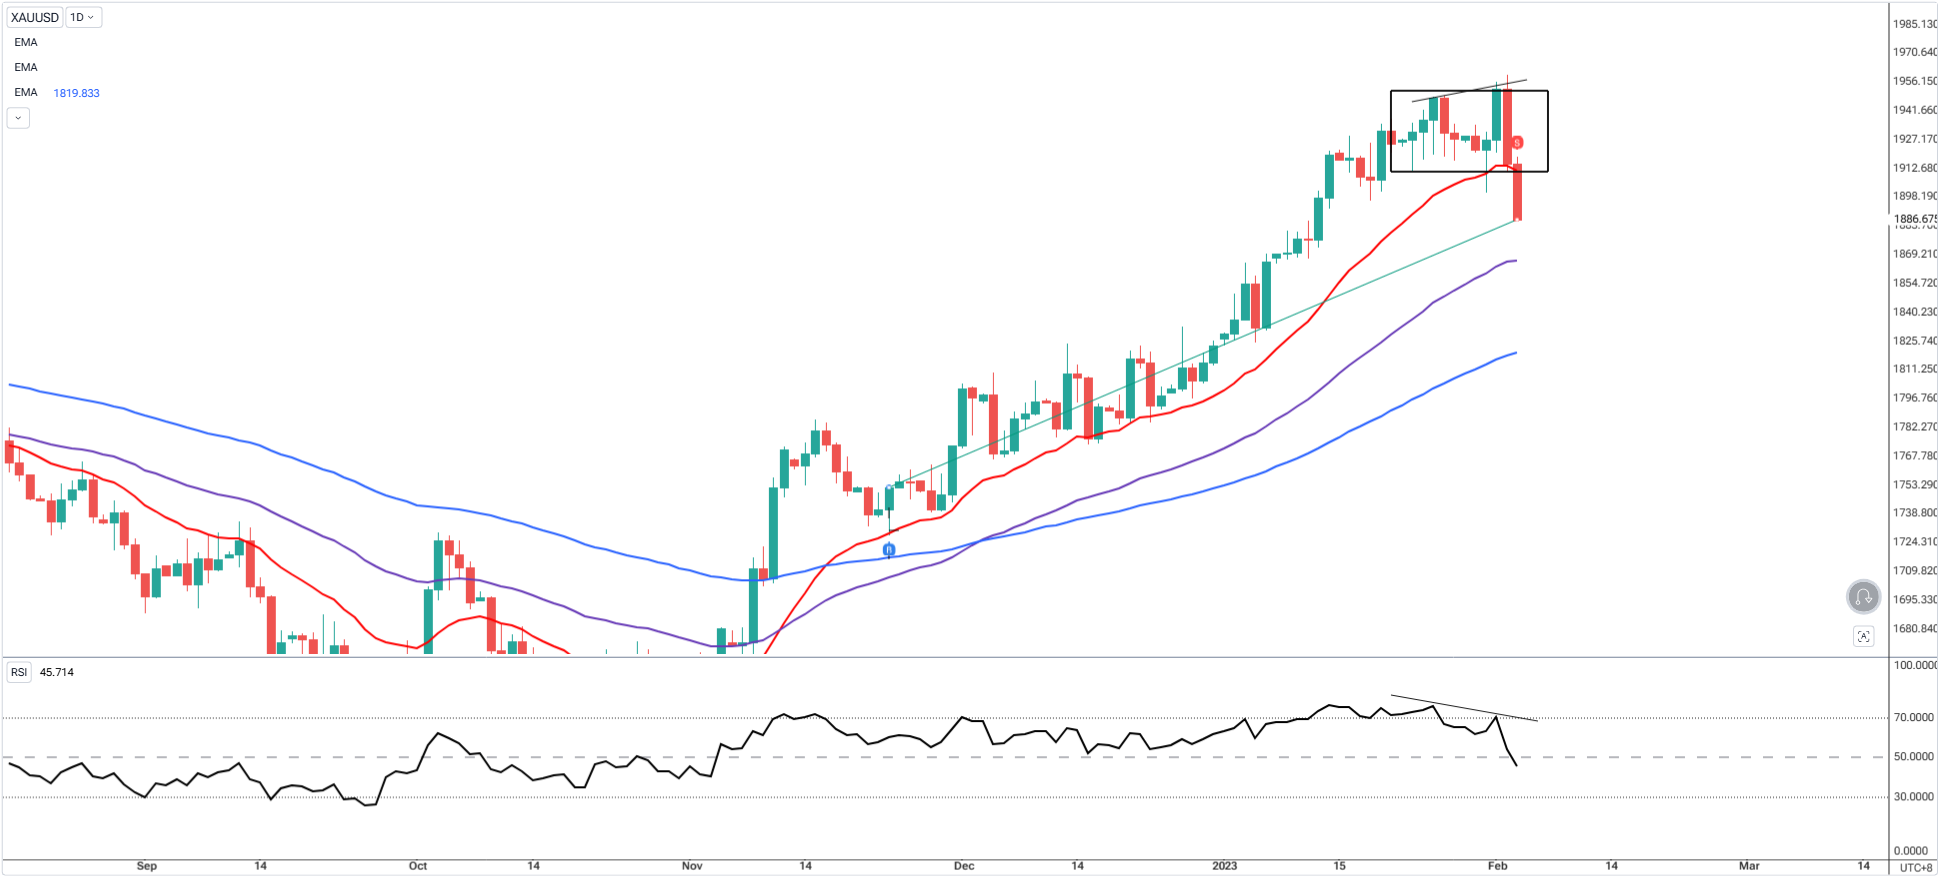
After your breakout entry is live and protected with a stop, go to the Daily timeframe.
Why?
Because this is where the macro structure lives, if price is breaking out of a compression zone or continuing a trend, this is where you’ll see it unfold — often riding far longer than you expect on the smaller timeframes.
The 20 EMA on the Daily becomes your macro trail guide:
Bonus:
This method is especially powerful during trending phases after a breakout:
| Setup Style | Trend (HTF) | Entry Timing |
|---|---|---|
| Short-term momentum | 100 EMA (H4) | M15 |
| Balanced swing | 200 SMA (Daily) | H1 |
| Smooth pullback | 100 EMA (H1) | Price Action + EMA on M5 |
You can adjust these combos depending on the asset or volatility — but the core logic remains:
Trend confirmed → Bounce expected → Entry confirmed

In earlier parts of this series, we covered pullback strategies using single-timeframe MAs.
But not every pullback is equal. Some are just noise, others are traps. By waiting for confirmation on the lower timeframe, you move from guessing to executing with structure.
This is especially critical when price pulls back to a 20 EMA or 50 SMA. Alone, that means nothing. But if price structure confirms it, now you’re trading a bounce with purpose.

Moving averages alone don’t make the trade — they frame it.
When aligned across timeframes and confirmed by price action, they become powerful contextual tools that guide you through noise, fakeouts, and hesitation.
Trade the bounce, not because the line is there, but because the market structure says it’s time.
Open a free demo account today and experience institutional-grade spreads, lightning-fast execution, and all the tools you need to grow as a trader.
It’s time to go from theory to execution - risk-free.
Create an Account. Start Your Free Demo!
How To Trade & Scalp Indices at the Open Using Smart Money Concepts (SMC)
How to Trade Breakouts Effectively in Day Trading with Smart Money Concepts
Complete Step-by-Step Guide to Day Trading Gold (XAU/USD) with Smart Money Concepts (SMC)
The Power of Multi-Timeframe Analysis in Smart Money Concepts (SMC)
Forex Trading Strategy for Beginners
Mastering Candlestick Pattern Analysis with the SMC Strategy for Day Trading
Mastering Risk Management: Stop Loss, Take Profit, and Position Sizing
How to Use Fibonacci to Set Targets & Stops (Complete Guide)
RSI Divergence Trading Strategy for Gold: How to Identify and Trade Trend Reversals
Stochastics Trading Secrets: How to Time Entries in Trending Markets using Stochastics
Gold Trading Stochastics Strategy: How to Trade Gold with 2R–3R Targets
RSI Hidden Divergence Explained: How to Spot Trend Continuations Like a Pro
Why Smart Money Concepts Work in News-Driven Markets - CPI, NFP, and More
How to Trade NFP Using Smart Money Concepts (SMC)-A Proven Strategy for Forex Traders
How to Trade CPI Like Smart Money - A Step-by-Step Guide Using SMC
How to Start Trading Indices and Get into the Stock Market with Low Capital (2025 Guide)
Best Indices to Trade for Day Traders | NASDAQ, S&P 500, DAX + Best Times to Trade Them
How To Trade & Scalp Indices at the Open Using Smart Money Concepts (SMC)
NAS100 - How to Trade the Nasdaq Like a Pro (Smart Money Edition)
How to Trade CPI Like Smart Money - A Step-by-Step Guide Using SMC
Why Smart Money Concepts Work in News-Driven Markets - CPI, NFP, and More
How to Swing Trade Gold (XAU/USD) Using Smart Money Concepts: A Simple Guide for Traders
Complete Step-by-Step Guide to Day Trading Gold (XAU/USD) with Smart Money Concepts (SMC)
The Ultimate Guide to Backtesting and Trading Gold (XAU/USD) Using Smart Money Concepts (SMC)
Why Gold Remains the Ultimate Security in a Shifting World
How to Trade Candlestick Patterns with High Probability: A Complete Guide for Beginners
The Top Japanese Candlestick Guide: What is an Engulfing Pattern and How to Trade It?
Piercing Pattern Candlestick Explained: How to Trade It - Step-By-Step Guide
Morning & Evening Star Candlestick Patterns – How to Trade Market Reversals with Confidence
5 Steps to Start Day Trading: A Strategic Guide for Beginners
8 Steps How to Start Forex Day Trading in 2025: A Beginner’s Step-by-Step Guide
3 Steps to Build a Trading Routine for Consistency and Discipline - Day Trading Edition
The Ultimate Guide to Understanding Market Trends and Price Action
Trading with Momentum: The Best Trading Session to Trade Forex, Gold and Indices
How to Identify Risk-On and Risk-Off Market Sentiment: A Complete Trader’s Guide
How to Trade Risk-On and Risk-Off Sentiment - With Technical Confirmation
The Ultimate Guide to Understanding Market Trends and Price Action
Why Smart Money Concepts Work: The Truth Behind Liquidity and Price Action
Mastering the Market with Smart Money Concepts: 5 Strategic Approaches
Mastering Candlestick Pattern Analysis with the SMC Strategy for Day Trading
Understanding Liquidity Sweep: How Smart Money Trades Liquidity Zones in Forex, Gold, US Indices
The SMC Playbook Series Part 4: How to Confirm Trend Reversal & Direction using SMC
The SMC Playbook Series Part 5: The Power of Multi-Timeframe Analysis in Smart Money Concepts (SMC)
Fair Value Gaps Explained: How Smart Money Leaves Footprints in the Market
The Best Time to Use Smart Money Concepts (SMC): Why Timing Is Everything in Trading SMC
How to Trade the London Session Using Smart Money Concepts (SMC)
The Mental Game of Execution - Debunking the Common Trading Psychology
5 Steps to Backtest a Trading Strategy with AI: A Step-by-Step Guide
Managing Trading Losses: Why You Can Be Wrong and Still Win Big in Trading
The Hidden Threat in Trading: How Performance Anxiety Sabotages Your Edge
Why You Fail in Trading: You Don’t Have Enough Capital to Survive
Why 90% of Retail Traders Fail Even with Profitable Trading Strategies
The Top 10 Best Trading Books That Changed My Mindset, Strategy & Performance
Discovering Your Trader Profile: What Kind of Trader Are You?
Follow me for more daily market insights!
Jasper Osita - LinkedIn - FXStreet - YouTube
This content may have been written by a third party. ACY makes no representation or warranty and assumes no liability as to the accuracy or completeness of the information provided, nor any loss arising from any investment based on a recommendation, forecast or other information supplies by any third-party. This content is information only, and does not constitute financial, investment or other advice on which you can rely.
ACY Securities is one of Australia's fastest growing multi-asset online trading providers, offering ultra-low-cost trading, rock-solid execution, technologically superior account management and premium market analysis.
Select the categories and companies you wish to follow directly to your person rss feed.
Create Custom RSS FeedSign up and join over 5,000 professional members who receive personalized news alerts, curated professional connections, and more for free!
Sydney-based multi-asset broker ACY Securities has introduced PAXGUSD, a new CFD instrument that allows clients to trade tokenised gold against the US Dollar 24 hours a day, seven days a week. The instrument is available across MetaTrader 4, MetaTrader 5, and the ACY Trading Platform.
Binance has lowered its VIP 3 Wallet Assets threshold from $3 million to $1 million and will now count OTC Spot Trading Volume at a 4x multiplier toward VIP qualification, removing the previous VIP 4 cap and allowing eligible users to progress through the full tier framework up to VIP 9.
Retail futures trading leader NinjaTrader Group has appointed Mark Omens as Senior Vice President, Commercial Strategy, bringing a 25-year veteran of derivatives marketplace CME Group into a newly created role focused on exchange partnerships and enterprise growth.
Gold Price Action Forecast: Will XAU/USD Drop to $3930? Meta Description: Read our Gold price action forecast to see if XAU/USD will drop to $3930.
BitDelta Securities Financial Services LLC (“BitDelta Securities”) today announced that it has received full regulatory approval from the Capital Market Authority (“CMA”) of the United Arab Emirates under the Category 5 — Arrangement and Advice license framework (License No. 20200000439). The approval follows the firm's receipt of In-Principal Approval earlier this year and represents the successful conclusion of the CMA's full licensing process, including the satisfaction of capital requirements, governance appointments, and operational setup.
Crypto.com has received a $400 million strategic investment from Citadel Securities, valuing the firm at $20 billion. It marks the first institutional funding round in the company's history, aimed at accelerating its expansion into tokenised securities, derivatives and other asset classes.
WTI’s pullback into $79–82 is the first major test of the bullish Elliott Wave count, with buyers targeting a renewed break above $85.

BitDelta Securities has secured a full CMA Category 5 licence in the UAE and opened a regulated office in Business Bay, Dubai. The firm operates as an introducing broker, connecting investors with licensed international brokers across multiple asset classes, with CEO Dr. Demetrios Zamboglou commenting on the milestone.
Index volatility is asleep while single stocks fight it out underneath, credit refuses to confirm the equity rally, and a bare macro calendar hands next week to oil.
Digital assets and FX brokerage GC Exchange FZE (GCEX) has appointed Mohammed A. Mulla as a Board Member of its Dubai-based entity, part of the wider GCEX Group.