just now

Liquidity Finder Ltd is incorporated in England and Wales, company number 10610740, registered address 167-169 Great Portland Street, Fifth Floor, London W1W 5PF, United Kingdom.
Published: just now


The NAS100 price forecast remains bullish after price showed a clear bullish rejection at the former weekly resistance level and broke above daily resistance.
The weekly chart is still showing a bullish trend, meaning NAS100 has generally been moving higher. Price is also trading above the 50 EMA, supporting the broader upward trend.
The weekly rejection shows that buyers have defended the former resistance level as support.
Meanwhile, the daily chart has already broken above the 30,540–30,750 resistance zone.
This creates an important question:
Can NAS100 hold the broken daily resistance as support and continue higher?

Weekly Chart Price Action from September 28 - October 2, 2026
The weekly NAS100 chart maintains a bullish market structure.
During September 28 – October 2, 2026, price retested the former weekly resistance as support after previously breaking above it.

Current Weekly Chart Price Action. Price Rejected Weekly Support Level and Head and Shoulder Pattern
This week, price has already shown clear bullish rejection from that support level, indicating that buyers have stepped in and pushed price higher.
This reaction strengthens the view that the former weekly resistance is now acting as support, supporting potential bullish continuation.
Weekly chart observations:
Price has already shown clear bullish rejection from both weekly support and the inverted head and shoulders neckline. This shows that buyers have defended the overlapping area, strengthening the bullish continuation setup.

Daily Chart Price Action from September 28 - October 2, 2026
During September 28–October 2, NAS100 stalled within a consolidation range between 30,540–30,750 daily resistance and 30,000–30,400 weekly support.
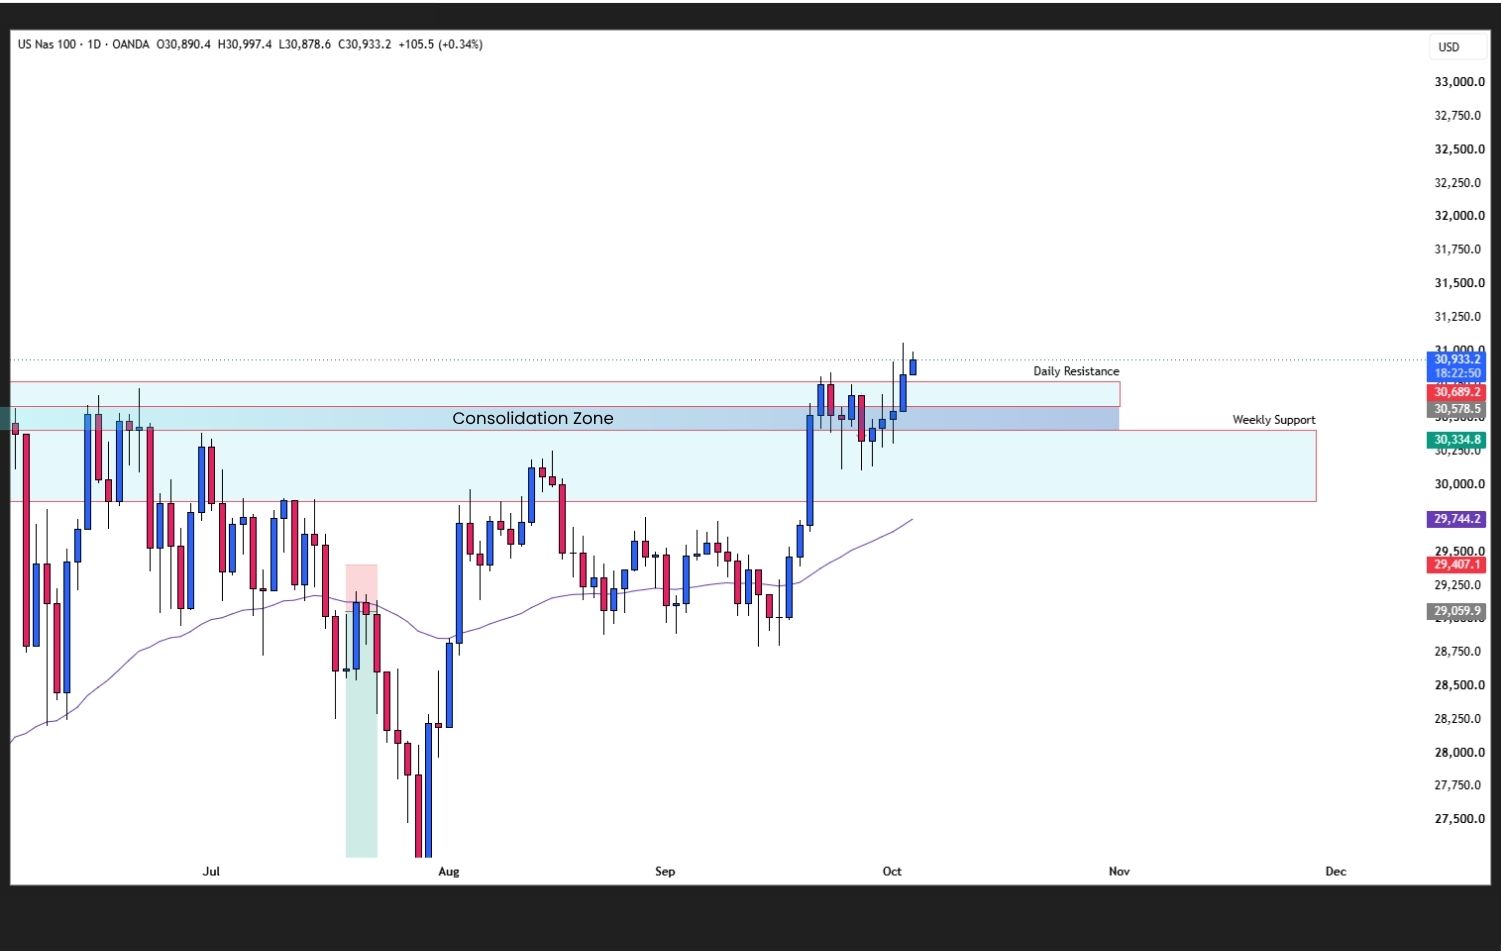
Current Daily Chart Price Action. Price Breakout Above Consolidation Zone
This week, price has already broken above the daily resistance zone, showing a bullish breakout from the previous range.
The move indicates that buyers have pushed price beyond the upper boundary, supporting the bullish continuation outlook.
The next step is to watch whether 30,540–30,750 holds as support during a retest. A successful retest and bullish rejection would strengthen the breakout setup.
Daily chart observations:
Support and resistance are areas where price has previously reacted.
Support is an area where buyers may become active.
Resistance is an area where sellers may become active.
Once price breaks above resistance, that same area can become support during a retest.
For NAS100, these are the key levels to watch:
| NAS100 LevelWhat It Means |
| 30,540–30,750Broken daily resistance; potential support |
| 30,000–30,400Key weekly support zone |
| Weekly 50 EMATrend indicator and possible dynamic support |
| 29,000Potential downside level if weekly support breaks |

Daily Timeframe Price Action Analysis. Bullish Bias Anticipation
The weekly chart has already shown bullish rejection, and the daily chart has already broken resistance.
The next confirmation would be a successful daily retest.
A break and retest means:
For NAS100, the area to watch is 30,540–30,750.
If price returns to this zone and forms a bullish rejection candle, it could show that buyers are defending the breakout.
A move above the nearby swing high would add further confirmation.

Daily Timeframe Price Action Analysis. Bullish Stop-loss Placement
Bullish idea: Weekly bullish rejection → daily breakout → successful retest →
potential continuation higher.
If price continues higher without returning to the zone, the breakout may still extend. However, the retest setup would remain pending.
A breakout does not always lead to a lasting move higher.
If NAS100 falls back below 30,540–30,750, traders should watch whether buyers can recover the zone.
A brief pullback into the area can be part of a normal retest.
The stronger warning would be a daily close below 30,540, followed by a failed attempt to move back above the zone.
This could bring 30,000–30,400 weekly support back into focus.
Losing the daily breakout zone would weaken the short-term bullish setup. The broader weekly outlook would then depend on whether weekly support continues to hold.

Daily Timeframe Price Action Analysis. Bearish Bias Anticipation
The bearish scenario becomes stronger if NAS100 breaks below the 30,000–30,400 weekly support zone.
A close below 30,000 would show that price has moved beneath the entire zone.
After the breakdown, traders can watch for a retest.
If price returns to the broken support and sellers push it lower, the former support could become resistance.

Daily Timeframe Price Action Analysis. Bearish Take Profit and Stop-loss Placement
A short-term wick below support would not automatically confirm a bearish reversal.
The stronger signal would be a close below support, followed by a failed retest and further selling.
Bearish idea: Weekly support breaks → close below 30,000 → failed retest → potential move toward 29,000.
The 50 EMA helps traders identify the general trend.
On the NAS100 weekly chart, price trading above this moving average supports the bullish outlook.
However, the EMA alone does not confirm an entry.
Traders can combine it with:
In this setup, the weekly rejection and daily breakout provide the main price action signals. The 50 EMA adds context to the broader trend.
The NAS100 price forecast remains bullish, supported by clear weekly rejection at former resistance and a daily breakout above 30,540–30,750.
The next area to watch is the broken daily resistance.
If buyers defend it as support, the bullish continuation setup becomes stronger.
If price falls back below the zone, attention returns to 30,000–30,400 weekly support. A confirmed breakdown below that area could bring 29,000 into focus.
Watch the retest. Wait for confirmation. Let price show whether buyers can hold the breakout.
_____________________________________________________________________________________
Move from learning price action to applying it in the real market.
Trade:
Access trading platforms and tools including ACY, MT4, MT5, and Copy Trading.
Create an Account and Start Live Trading
_____________________________________________________________________________________
Build your trading foundation with these step-by-step guides:
Learn to read price action and assess trading setups at key levels:
Learn to recognize bullish, bearish and sideways markets:
Learn to mark key levels and interpret price reactions:
Understand recurring price patterns, retests and false breakouts:
Learn to combine candlestick signals with price action analysis:
Learn to recognize patterns that may signal a change in market direction:
Explore how to combine the exponential moving average with price action:
Bring your technical analysis skills together through a gold swing trading guide:
Learn how risk management and position sizing fit into your trading plan:
Learn how to plan take-profit targets using market structure and risk-reward:
Develop discipline, emotional awareness and a more consistent trading process:
Explore the psychological habits behind a disciplined trading approach:
_____________________________________________________________________________________
Not sure where to begin? Here’s a simple roadmap to guide you:
By building step by step; from basics → real trading → mastering the craft, you’ll gain clarity, confidence, and steady progress without ever feeling overwhelmed.
_____________________________________________________________________________________
Follow Ruffy Grant B. Capacio for Gold analysis, Forex trading ideas, price action education, trading psychology, and market insights: LinkedIn
ACY Securities: Join the Discord Server
Disclaimer:
Trading Forex, Gold, CFDs, cryptocurrencies, commodities, indices, and other leveraged financial instruments involves a high degree of risk and may not be suitable for all investors or traders. Market conditions can change rapidly, and leveraged trading can result in losses that occur quickly.
Before trading, carefully consider your investment objectives, level of experience, and risk tolerance. Only trade with capital you can afford to lose and seek independent financial or professional advice where appropriate.
All market analysis, price forecasts, technical commentary, trading scenarios, educational materials, and opinions presented in this content are provided solely for general informational and educational purposes. They do not constitute financial advice, investment advice, a recommendation, solicitation, or an offer to buy or sell any financial instrument.
Past performance and historical price movements are not reliable indicators of future results. Any price levels, targets, scenarios, or market outlooks discussed should be viewed as analysis rather than guarantees of future market performance. October 5, 2026
ACY Securities is one of Australia's fastest growing multi-asset online trading providers, offering ultra-low-cost trading, rock-solid execution, technologically superior account management and premium market analysis.

Select the categories and companies you wish to follow directly to your person rss feed.
Create Custom RSS FeedSign up and join over 5,000 professional members who receive personalized news alerts, curated professional connections, and more for free!
AUDJPY price forecast: Watch resistance at 110.045–110.403 for bearish rejection toward 109.283 or a bullish breakout targeting 111.550.
GER40 price forecast: DAX 40 tests 25,285–25,390 resistance. Explore bearish rejection, the neckline retest and bullish breakout confirmation.
NAS100 price forecast: Nasdaq 100 breaks above 30,750 after bullish weekly support rejection. Explore key levels, retest confirmation and downside risks.
XTB Institutional is heading to iFX EXPO Asia 2026 in Hong Kong. Meet the team at Booth #95 to discuss institutional liquidity, 24/7 market access and the latest trading conditions.
Profitable traders improve retention and brand credibility. They also break B-book distributions silently, over quarters. Most brokers find out too late.
Ondo Finance, a blockchain technology company focused on tokenising real-world assets, has announced Ondo Private Markets, a product offering tokenised exposure to privately held companies, beginning with an unnamed pre-IPO artificial intelligence company.
STARTRADER has launched 20 new Stock and ETF CFDs on MT5, tradable Monday to Sunday, with half listed in Seoul or Hong Kong. The additions focus on AI's physical infrastructure, covering HBM and DRAM supply chain names such as SK hynix and Hanmi Semiconductor, plus data-centre exposure through Cloudflare and Vistra.
IG Group has cut its 2026 revenue growth outlook after weaker revenue retention in its over-the-counter derivatives business outweighed growth in customer activity, putting the economics of its revised market-making approach in focus.
CME Group has withdrawn its filing to launch a 10-Barrel WTI Crude Oil futures contract that would have traded 24 hours a day, seven days a week. The exchange said industry participants were concerned that 24/7 energy trading could create unintended consequences without further due diligence.
Multibank FX aggregation service FXSpotStream reported a record average daily volume (ADV) of USD 179.118 billion for September 2026, replacing the previous high of USD 173.6 billion set in March this year.