just now


Liquidity Finder Ltd is incorporated in England and Wales, company number 10610740, registered address 167-169 Great Portland Street, Fifth Floor, London W1W 5PF, United Kingdom.
Published: just now

The US NAS 100 remains at an important technical decision point as price continues to react around key support and resistance levels.
While the broader higher-timeframe structure remains bullish, recent price action suggests that sellers are gaining control in the short term. A rejection from major resistance, combined with a bearish engulfing candlestick and a break below the previous daily higher low, has shifted the short-term outlook toward the downside.
The key levels to watch are $29,400 - $29,215 on the downside and the $29,900 - $30,400 resistance level above.
Rather than chasing price inside the current structure, the focus should remain on a confirmed break, retest, and candlestick confirmation.
The question is:
Could a confirmed break below $29,400–$29,215 trigger a bearish correction toward $28,600?

Weekly Timeframe Price Action Analysis. Market Structure Forming a Potential Higher High (HH)
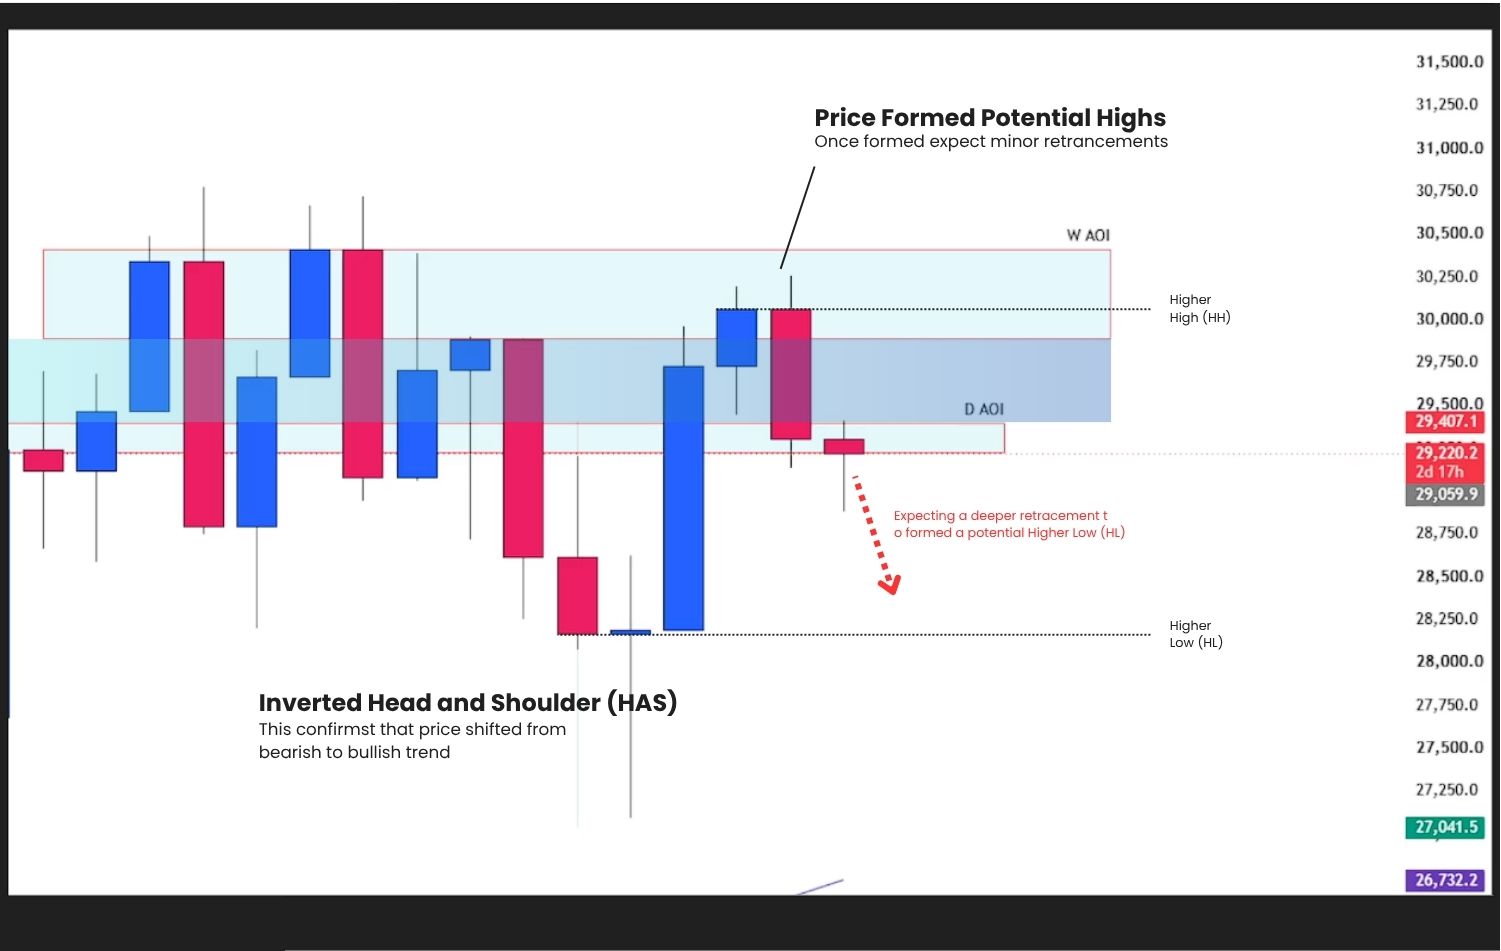
The weekly timeframe continues to show a broader bullish market structure, but recent price action is raising questions about whether the market is preparing for a deeper retracement.
Price recently rejected a major weekly resistance level, with sellers producing a strong bearish engulfing candlestick. This suggests that buyers were unable to maintain control at higher prices and that sellers successfully defended the resistance zone.
Weekly Chart Price Action Analysis
The rejection does not automatically confirm a long-term bearish reversal. Instead, it may represent a corrective phase within the broader bullish structure.
Weekly chart observations
The key point is that one bearish reaction does not invalidate the higher-timeframe bullish structure. Confirmation is still required.

Daily Chart Price Action Analysis. Price Break Below Consolidation Zone
The daily timeframe presents a more bearish picture.
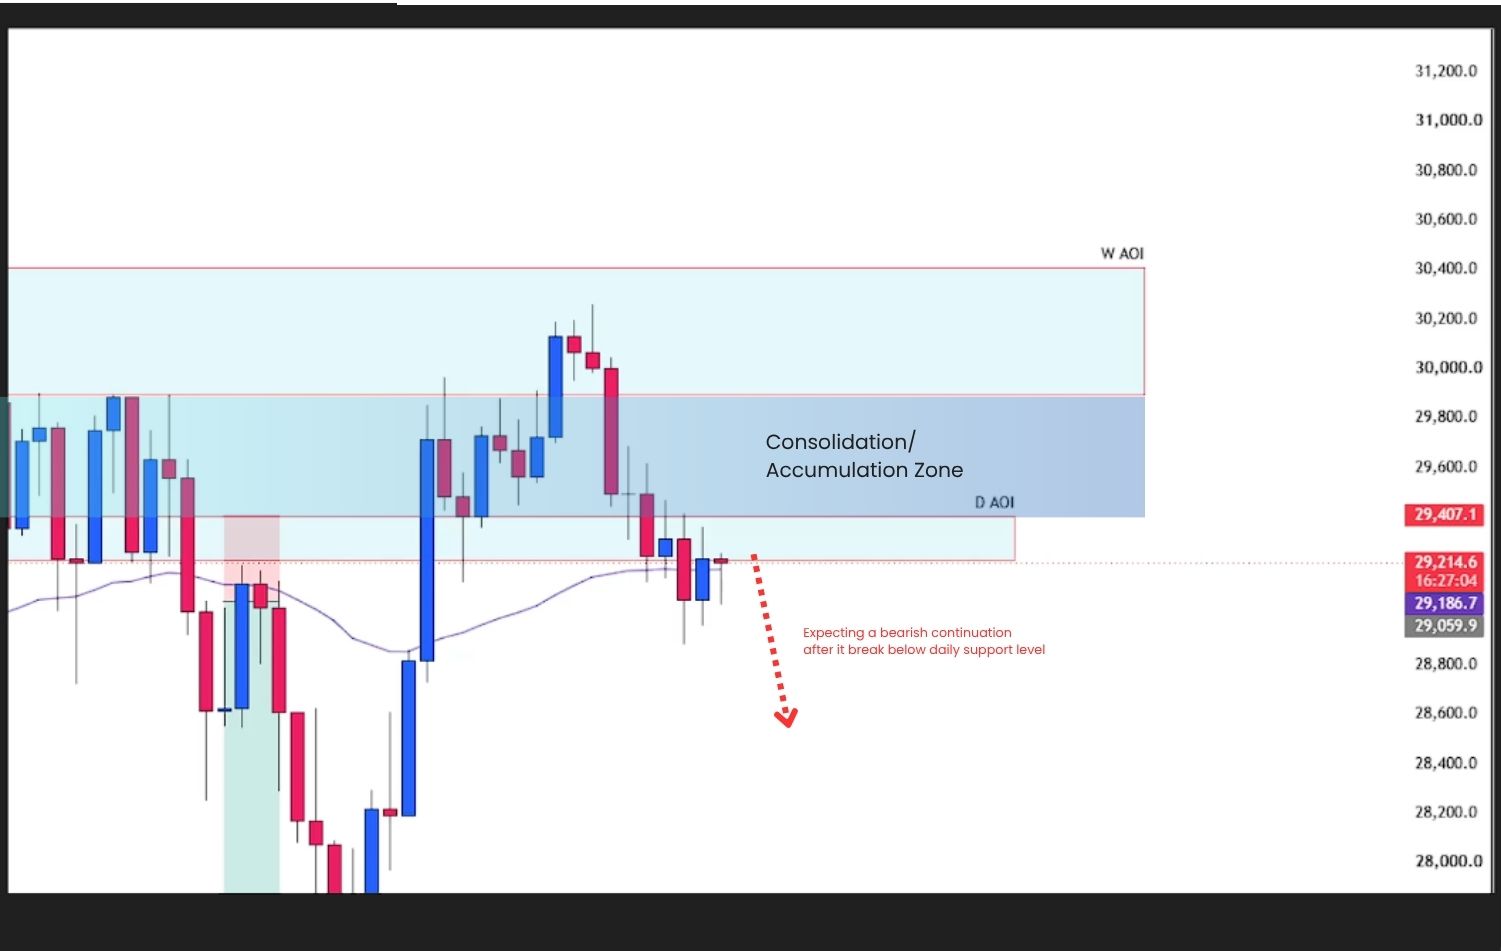
Price recently broke below the previous Higher Low (HL) and the support area that had been holding the bullish structure together. The market has also broken below the previous consolidation zone.
Daily Chart Price Action Analysis
This represents an important technical development because a break below a previous higher low can signal that buyers are losing control and that the market may be transitioning into a bearish phase.
Price is also trading below the 50 EMA, providing secondary confirmation that short-term momentum has shifted toward the downside.
Daily chart observations
However, a breakdown alone is not enough.
The retest is where confirmation becomes important.
Instead of forcing a trade while price remains inside a potentially volatile structure, there are two scenarios worth watching.
The trading plan is simple:
Wait for price to come to the level.
Wait for confirmation.
Then execute.

Daily Chart Price Action Analysis. Bullish Bias Anticipation
The bullish scenario becomes more attractive if buyers regain control and price successfully breaks and retest above the major weekly resistance zone around $29,900–$30,400.
However, simply breaking above resistance is not enough.
I would want to see a proper breakout followed by a retest, with buyers defending the previous resistance as new support.
A bullish NAS 100 setup could develop if:

Daily Chart Price Action Analysis. Bullish Take Profit and Stop-loss Placement
Note: This bullish scenario requires strong confirmation because the daily structure has already shifted bearish.

Daily Chart Price Action Analysis. Bearish Bias Anticipation
The bearish scenario is currently the setup I would pay the closest attention to because it aligns with the recent daily bearish structure.
If NAS 100 properly retest and rejects the $29,400–$29,215 resistance level, sellers could gain the confirmation needed for another lower leg.
The potential downside target is around $28,600.

Daily Chart Price Action Analysis. Bearish Take Profit and Stop-loss Placement
Note: The bearish setup is considered higher probability because it aligns with the higher timeframe bearish market structure.
| LevelTechnical Importance | |
| $30,400 | Major weekly resistance / bullish breakout area |
| $29,900 | Key resistance within the weekly supply zone |
| $29,400–$29,215 | Key daily support / bearish breakout area |
| $28,600 | Potential bearish correction target |
The reaction around these levels could determine the next meaningful NAS 100 move.
The US NAS 100 price action forecast remains focused on confirmation.
A confirmed break below $29,400–$29,215 could open the door toward $28,600, while a reclaim of $29,900–$30,400 could invalidate the bearish setup and support further upside.
For now, the strategy is simple:
Don't chase. Don't force trades. Wait for price to come to the level, confirm the setup, and then execute.
Trade the setup. Manage the risk. Let price confirm the move.
______________________________________________________________________________________
The short-term outlook is bearish, while the broader weekly structure remains bullish.
The key support zone is $29,400–$29,215. A confirmed break below this area could signal further downside.
Yes. A confirmed break and retest below $29,400–$29,215 could open the path toward $28,600.
The major resistance zone is $29,900–$30,400. A confirmed breakout above this area could strengthen the bullish outlook.
Look for a break below support, retest as resistance, and bearish candlestick confirmation before considering a short setup.
A break above $29,900–$30,400, successful retest, and bullish rejection would provide stronger confirmation for upside.
No. The better approach is to wait for the break, retest, and confirmation before entering.
______________________________________________________________________________________
If you want to develop a professional trading mindset while learning how to identify high-probability price action setups across Gold, Forex, Crypto, Commodities and Indices, continue following our market analysis and educational guides.
For more in-depth market breakdowns, real-time analysis, and structured learning content, you can join our Discord community inside ACY Server:
Discord Server - ACY Securities Server
Start your live trading journey today!
• Trade Forex, indices, gold, crypto and other global markets
• Access powerful platforms including ACY, MT4, MT5, and Copy Trading tools
Move from learning simple price action to executing it in the real market with confidence!
Create an Account. Start Your Live Trading Now!
Build a strong trading foundation with step-by-step lessons designed for beginners:
Learn how to read market structure, identify key levels, and trade high-probability setups using pure price action.
Ready to learn simple price action strategy? Here’s how to do it step by step:
Learn how to identify bullish, bearish, and sideways markets using price action to make more informed trading decisions:
Ready to learn and capitalize the repetitive patterns in the markets? Here’s how to do it step by step:
Discover how candlestick patterns can help confirm market direction:
Gold is still one of the most traded assets, here’s how to trade it with confidence:
Your mindset is what separates steady growth from costly mistakes. Focus on these essentials:
Develop the mindset of a professional trader by mastering discipline, emotional control, patience, and consistency to achieve long-term trading success:
Learn the essential risk management strategies to protect your capital, manage losses, and trade with confidence:
Not sure where to begin? Here’s a simple roadmap to guide you:
By building step by step; from basics → real trading → mastering the craft, you’ll gain clarity, confidence, and steady progress without ever feeling overwhelmed.
Follow me for more daily market and educational insights!
Ruffy Grant B. Capacio - LinkedIn | Telegram | YouTube
ACY Securities - Discord
Disclaimer:
Trading forex and derivative instruments involves substantial risk and may not be suitable for all individuals. Only use funds that you are prepared to lose. It is important to understand how these markets work and the risks involved before trading, and to seek independent financial advice if needed. All market analysis and insights shared are intended for educational and informational purposes only and should not be considered financial or investment advice. August 26, 2026.
ACY Securities is one of Australia's fastest growing multi-asset online trading providers, offering ultra-low-cost trading, rock-solid execution, technologically superior account management and premium market analysis.

Select the categories and companies you wish to follow directly to your person rss feed.
Create Custom RSS FeedSign up and join over 5,000 professional members who receive personalized news alerts, curated professional connections, and more for free!
Bybit has launched Perp Options, described as the first options contracts built on TradFi perpetuals, giving traders round-the-clock access to US equity options. SpaceX and Nvidia are the first underlying assets, with USDT settlement and integration into Bybit's Unified Trading Account.
Use this trading preparation checklist to plan your session, define entry rules, manage risk, and build a disciplined trading routine in seven steps.
Your Bourse expands its crypto liquidity ecosystem with Caladan, giving brokers access to broader market coverage, institutional execution capacity and streamlined settlement.
Scope Markets, the retail brokerage part of Rostro Group, has appointed Ibrahim Hossny as Head of Research and Marketing for the Middle East and North Africa.
Hantec Prime, the institutional division of Hantec Markets, has reported trading volume up more than 300% year-to-date, alongside the addition of 42 new institutional clients since December, capping one of its strongest years of growth to date.
Learn how to refine XAUUSD support and resistance on the daily chart using candle bodies, market structure and weekly gold levels for swing trading. A slug alone cannot guarantee a top Google ranking. Keep it focused rather than adding every supporting keyword.
The week in Dubai will be focused on connecting directly with the industry and discussing how technology can help modern brokerages simplify operations, automate workflows, strengthen operational control, and scale efficiently.
Devexperts has launched a turnkey solution giving brokers in South Korea access to US equity markets, combining its DXtrade trading platform, dxFeed market data, and execution services. The offering targets South Korea's growing retail demand for US stocks, worth several billion USD monthly.
Assess why WTI crude oil surged past $105 per barrel amid Saudi pipeline disruptions, record tanker charter rates, and escalating geopolitical tensions.
Bitcoin price forecast: BTC/USD retests $78,460–$80,215 resistance. Watch bearish confirmation toward $72,480 or a bullish breakout toward $86,150.