just now

Liquidity Finder Ltd is incorporated in England and Wales, company number 10610740, registered address 167-169 Great Portland Street, Fifth Floor, London W1W 5PF, United Kingdom.
Published: just now

The Nasdaq 100 reversed from its 23,000 sweep after ISM and JOLTs data. Now testing the 23,500 FVG, will it break higher toward 23,800 or face rejection?
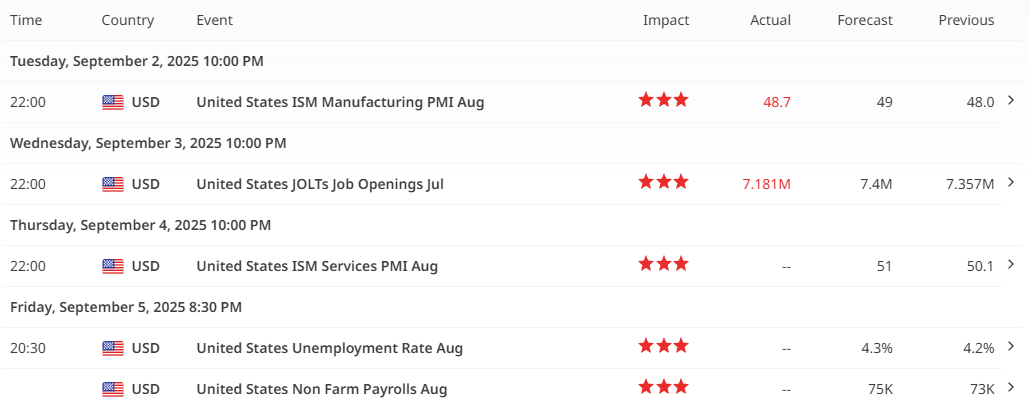
The move began on September 2, when the ISM Manufacturing PMI printed at 48.7 vs 49 forecast, confirming ongoing contraction in the U.S. factory sector. This raised fresh concerns about economic momentum and pushed equities lower, particularly high-valuation growth stocks in the Nasdaq.
A day later, the JOLTs Job Openings report showed a sharper-than-expected decline to 7.18M. While this initially reinforced the slowdown narrative, traders quickly reframed it as bullish for equities. A cooling labor market increases the probability of a September Federal Reserve rate cut, shifting sentiment from caution to opportunity.
The turning point came on September 3 when Alphabet secured a favorable antitrust ruling. Avoiding a breakup of its Chrome business, Alphabet surged nearly 8%, and Apple followed higher on confidence their partnership remained intact. This legal relief removed a major overhang on the Magnificent Seven and sparked a tech-led rebound, aligning with the bullish reversal scenario.
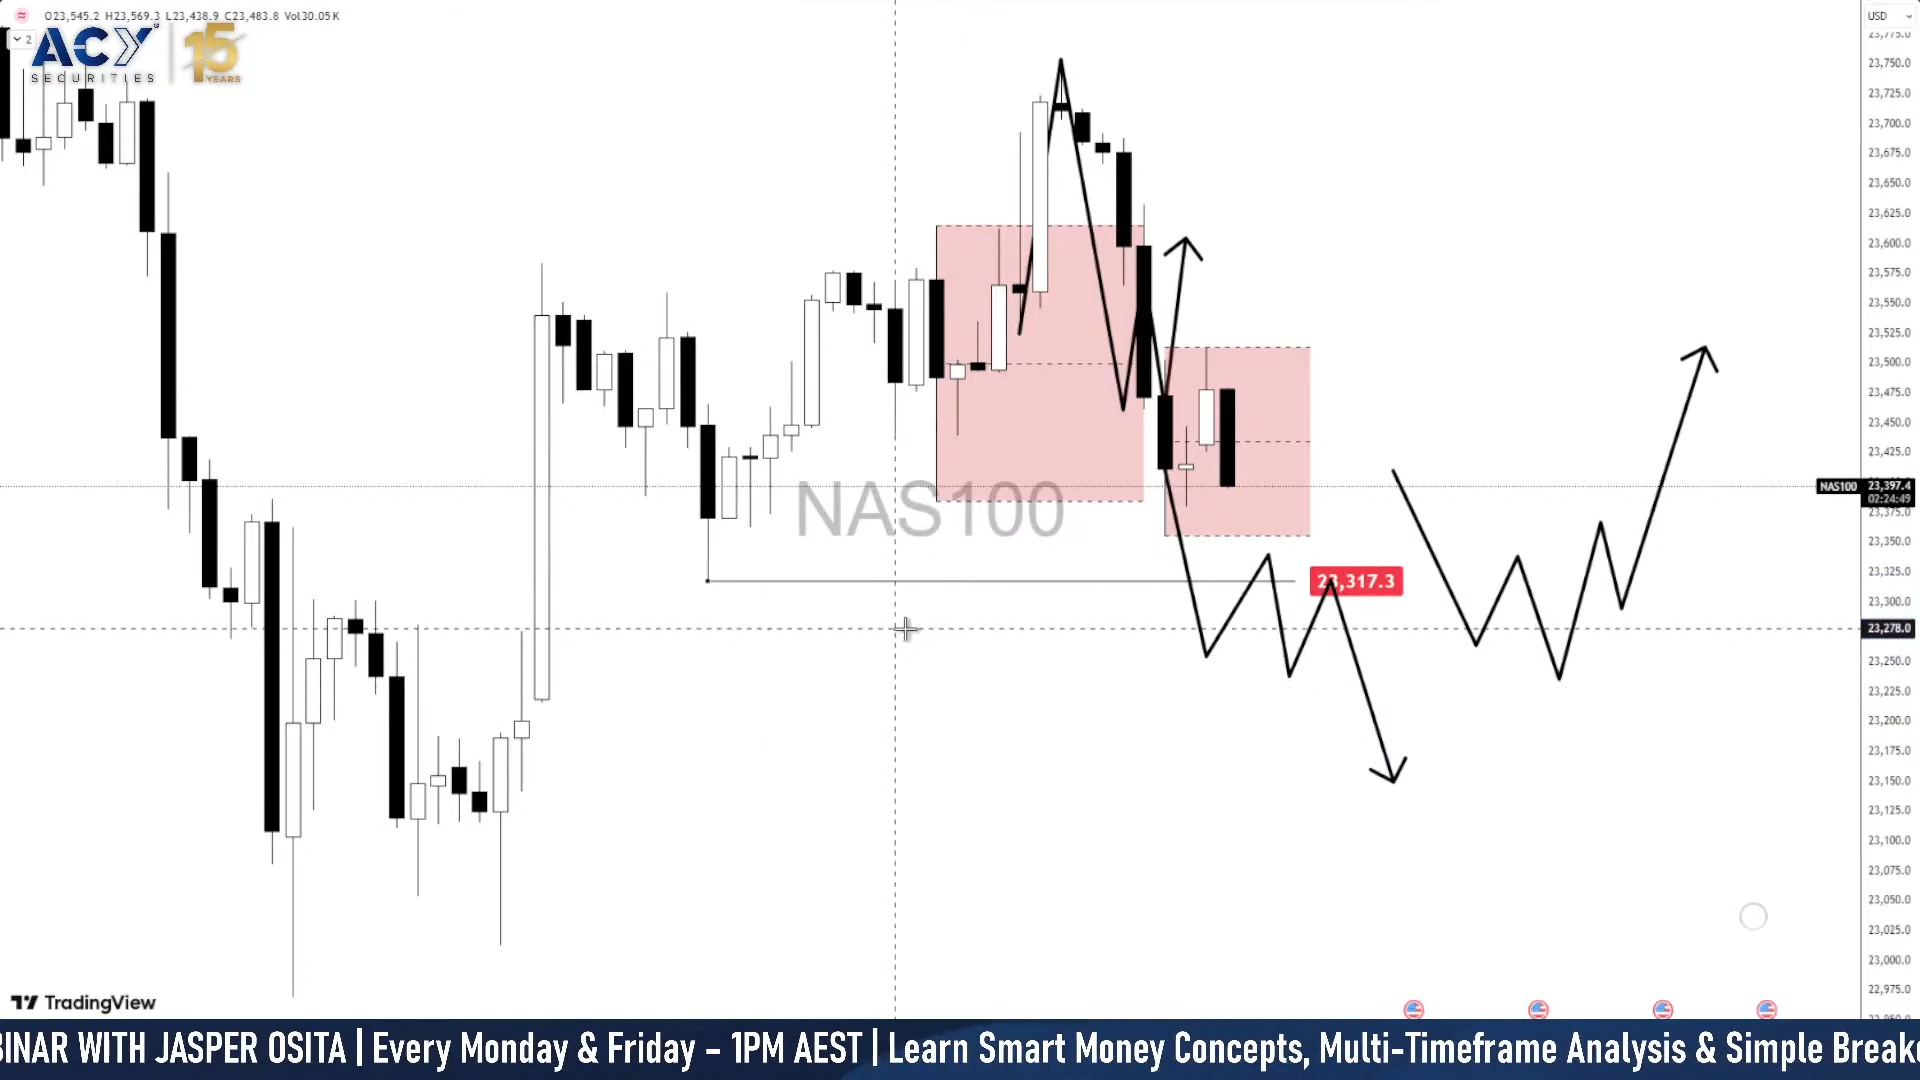
In the earlier outlook, Nasdaq 100 was positioned inside a corrective range with two clear paths:
The roadmap anticipated a bearish sweep first, followed by the potential for a bullish reversal if liquidity was absorbed.
That sequence played out cleanly:
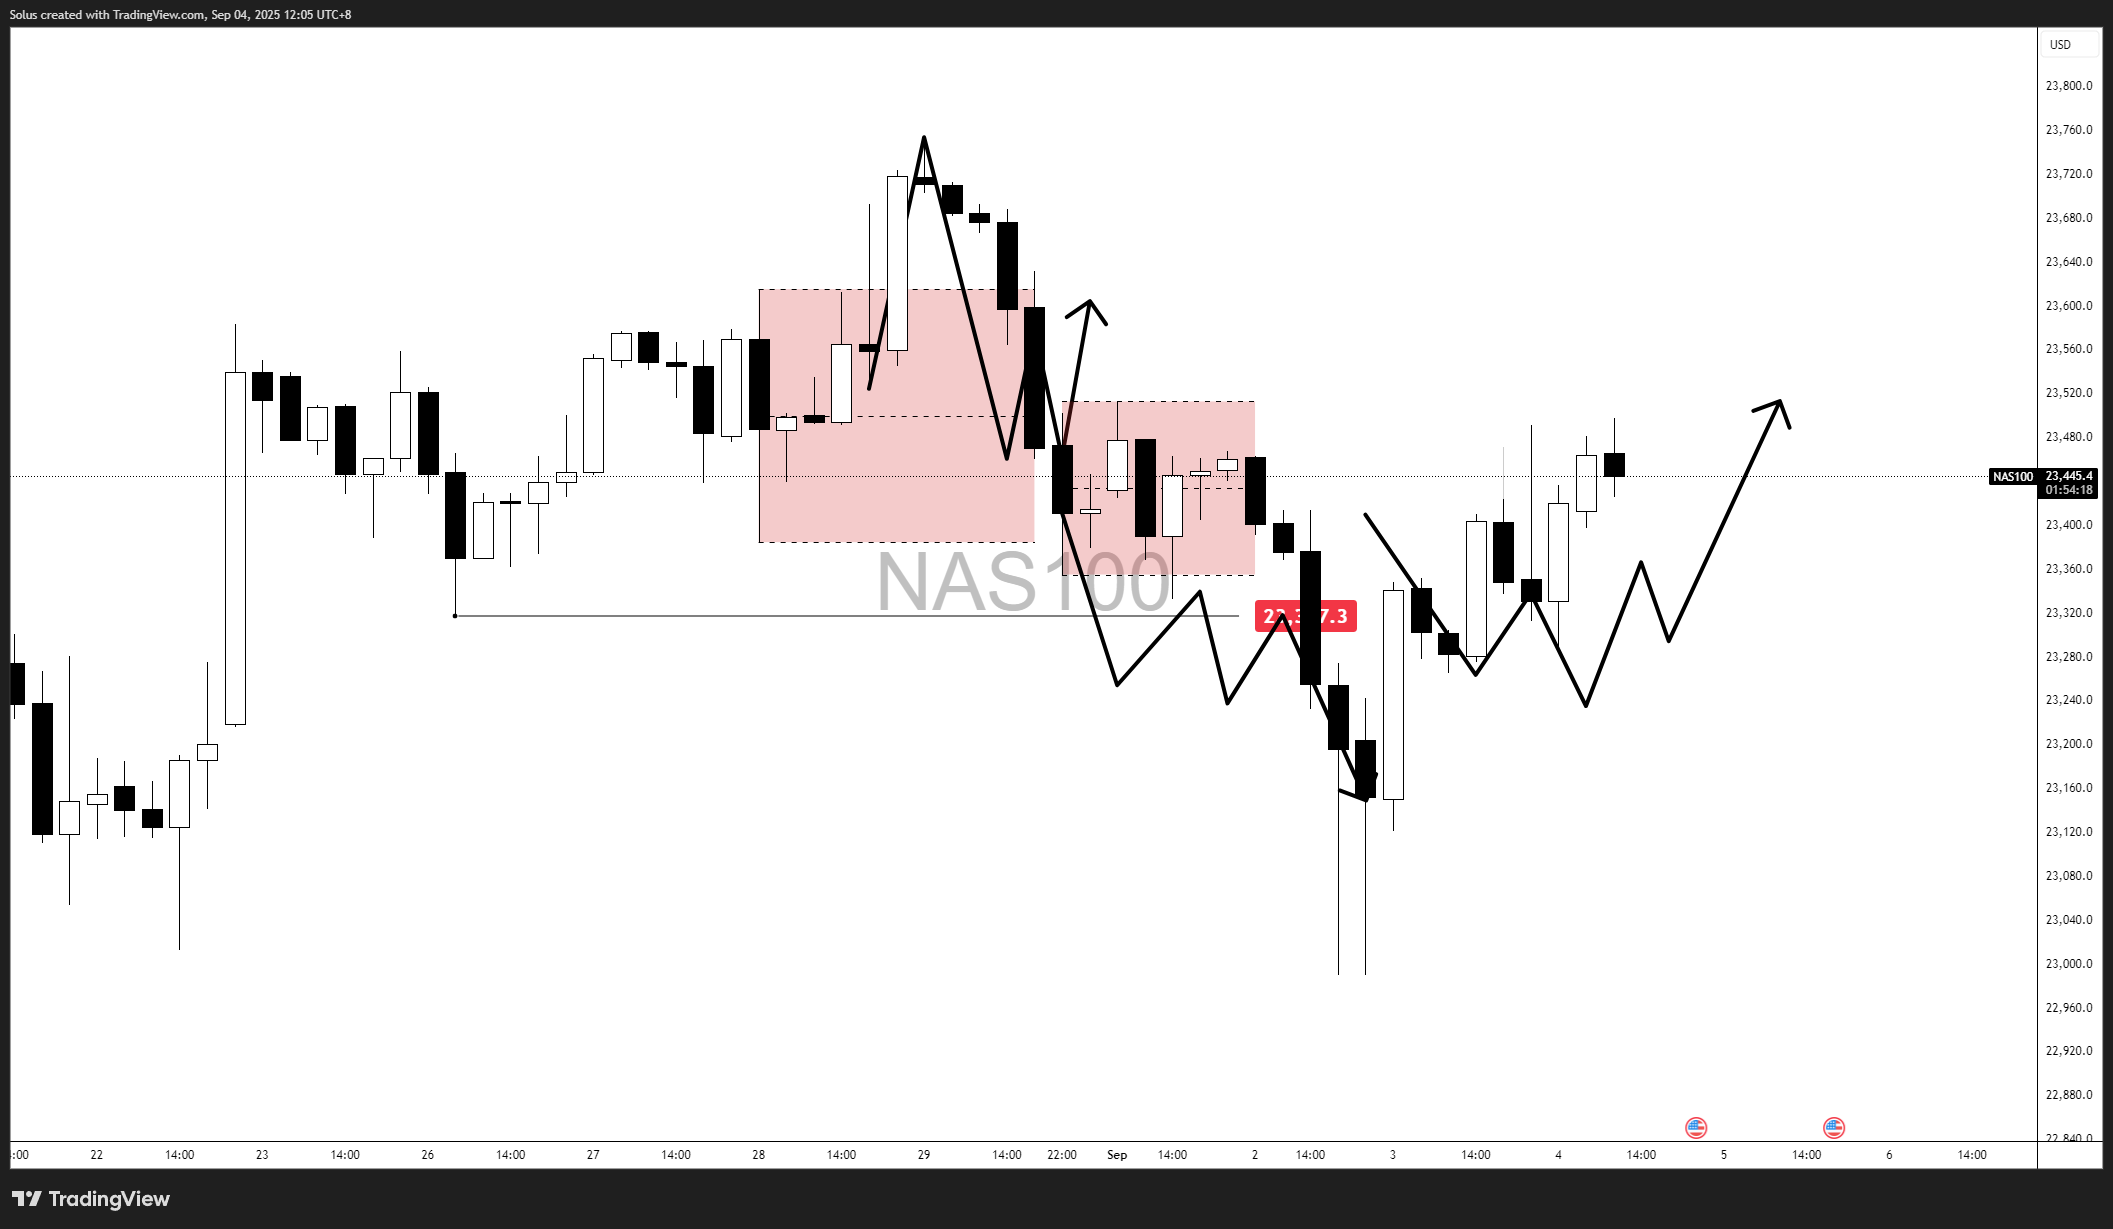
The Nasdaq 100 has swept the 23,000 liquidity low, flushing out sell-side positions and confirming the August 26 swing low as a defended zone. This sweep was decisive: after clearing that level, price rejected strongly, printing impulsive bullish candles back into the mid-range.
This move marks a classic liquidity grab → displacement → reversal structure, with buyers stepping back in after stop runs were completed.
The ISM Manufacturing PMI miss (48.7 vs 49) was the first driver of the bearish extension. It triggered the risk-off flows that helped Nasdaq pierce through support zones and eventually sweep the 23,000 level.
Following that, the JOLTs Job Openings decline (7.18M vs 7.4M forecast) shifted the narrative. While the headline was weak, markets interpreted it as dovish for Fed policy, increasing September rate cut bets. That change in perception provided the macro tailwind for Nasdaq’s sharp reversal right after the sweep.
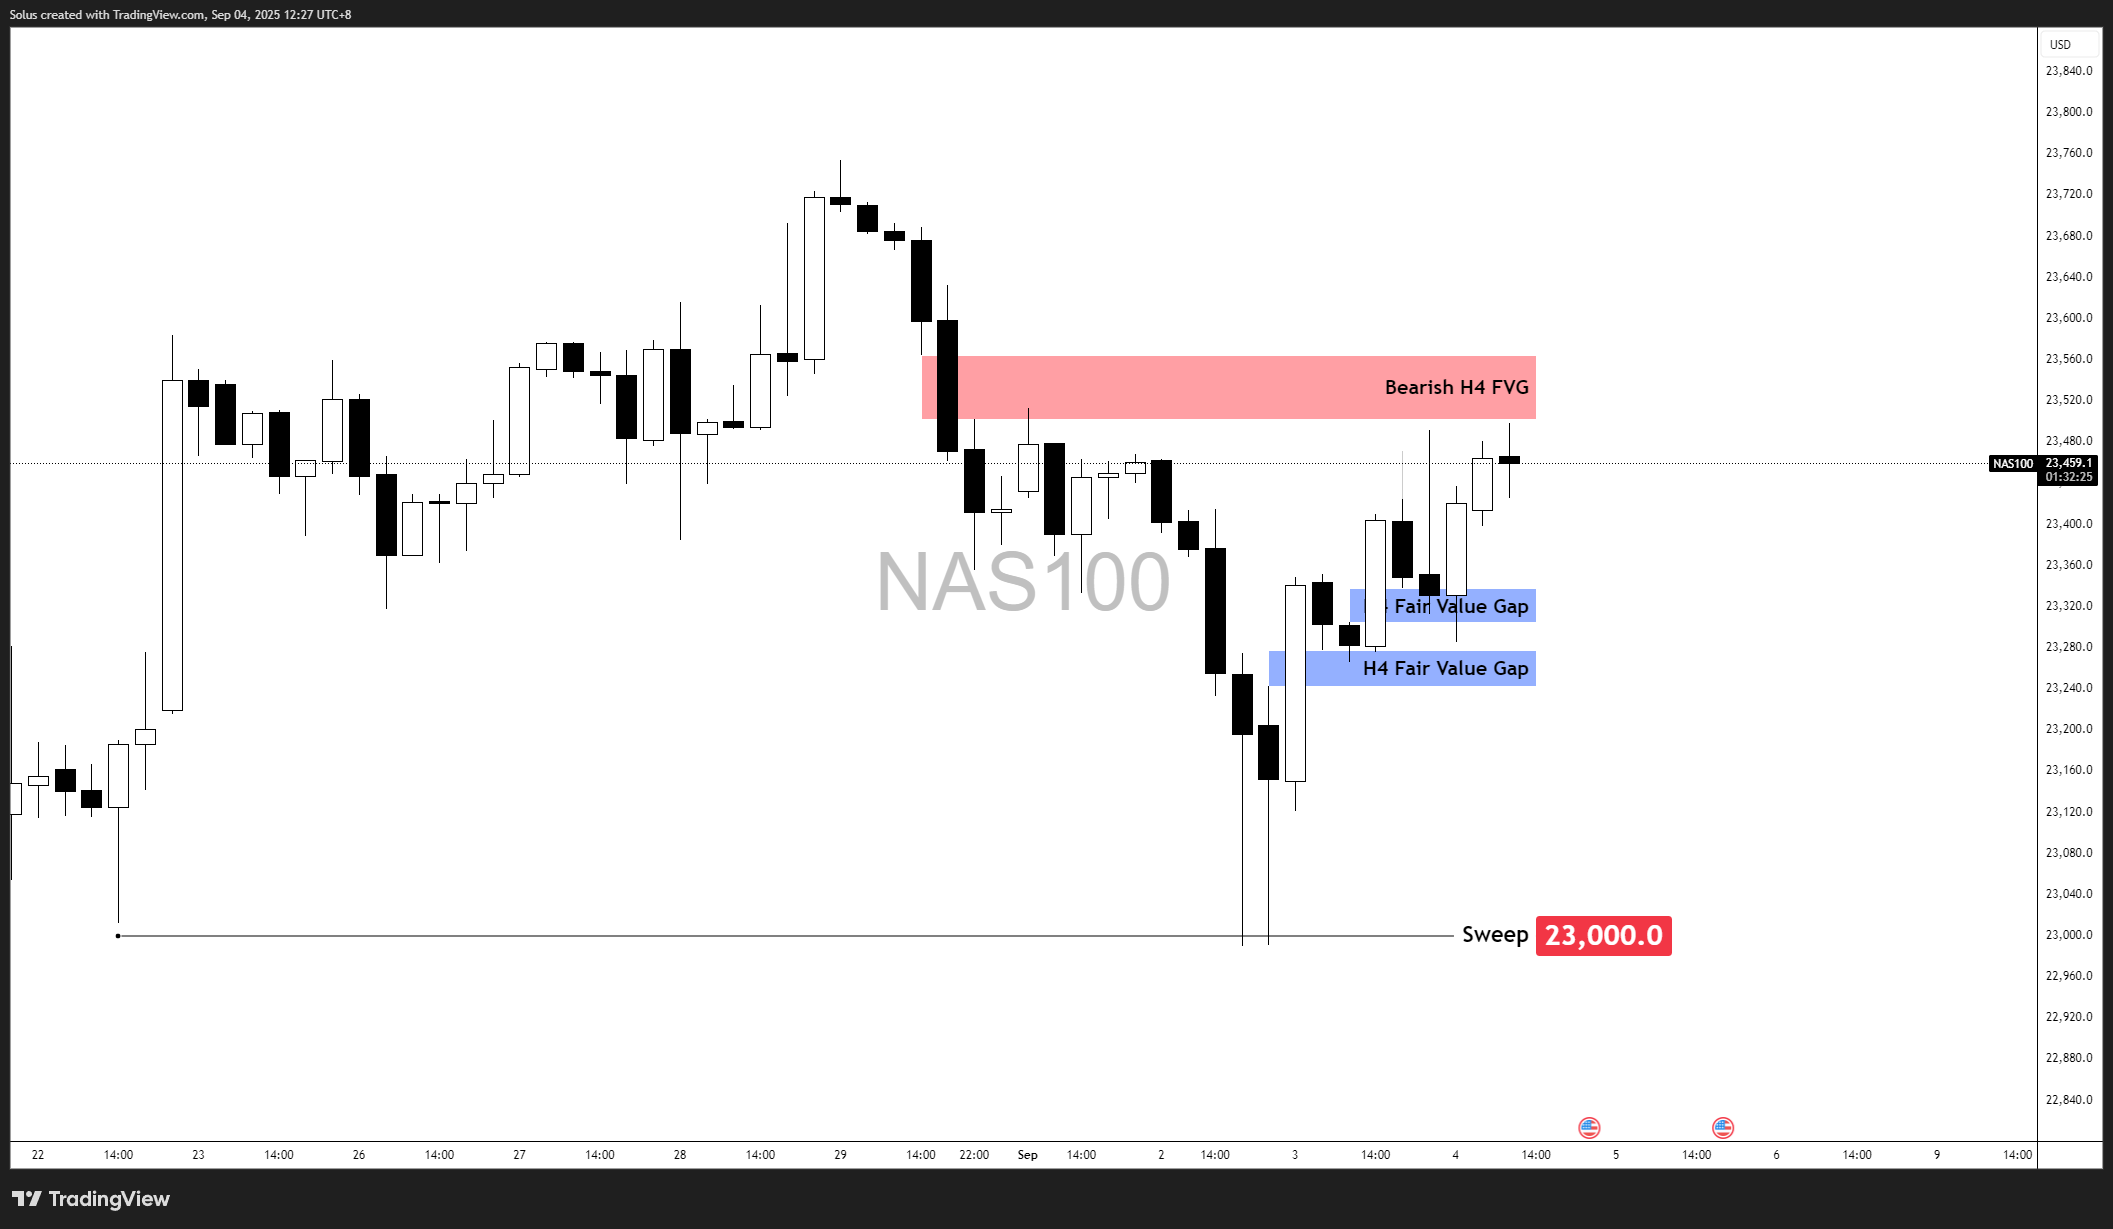
Post-sweep, Nasdaq has been climbing back and is now trading near 23,450, reclaiming lost ground. Two technical elements support the bullish view:
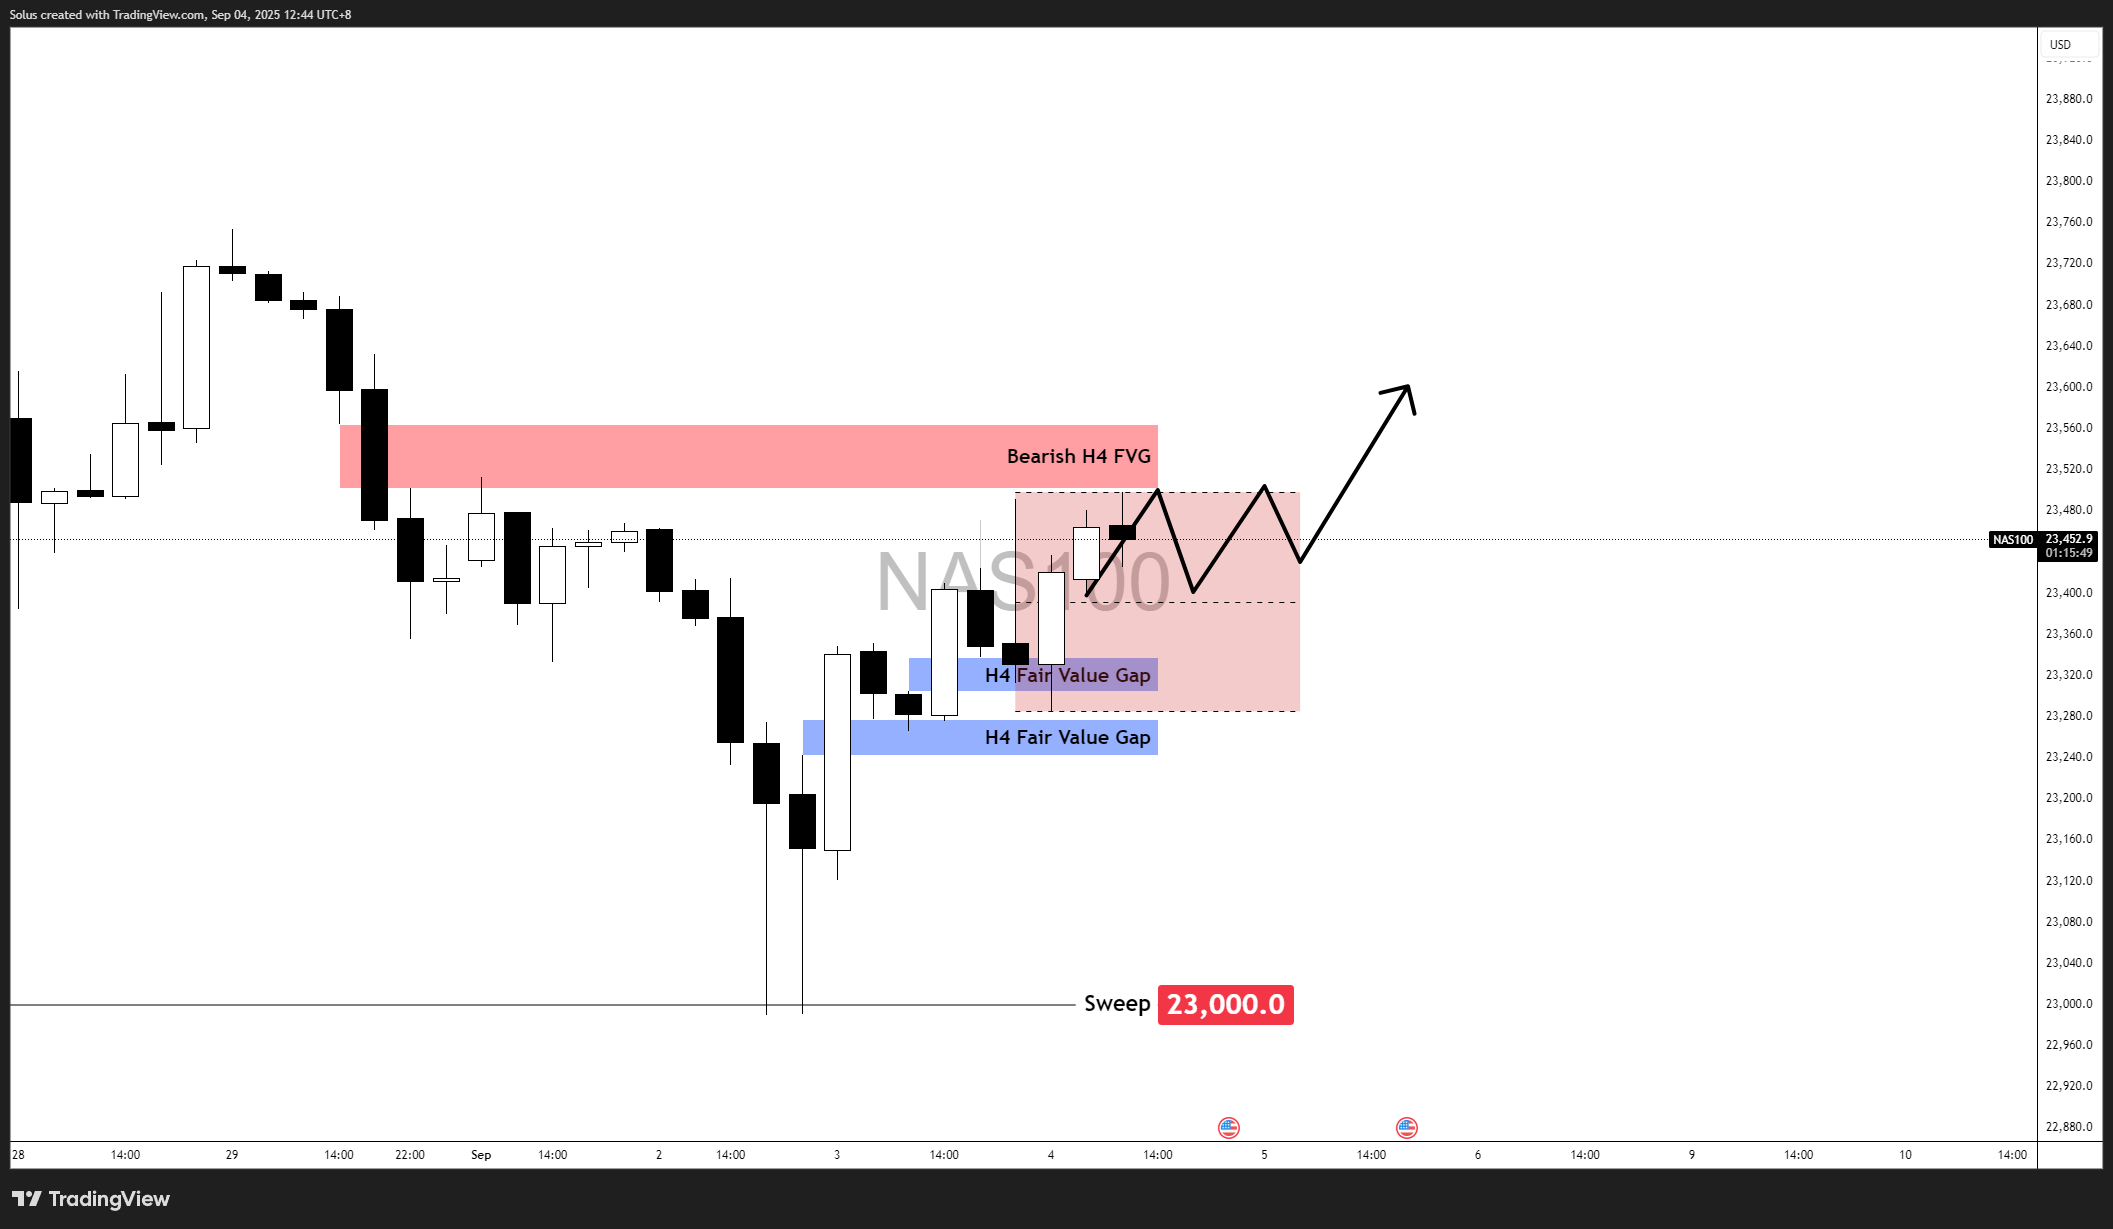
If Nasdaq manages to clear and hold above the 23,500–23,550 H4 FVG, it confirms that buyers are firmly in control. This would validate the reversal as more than just a corrective bounce.
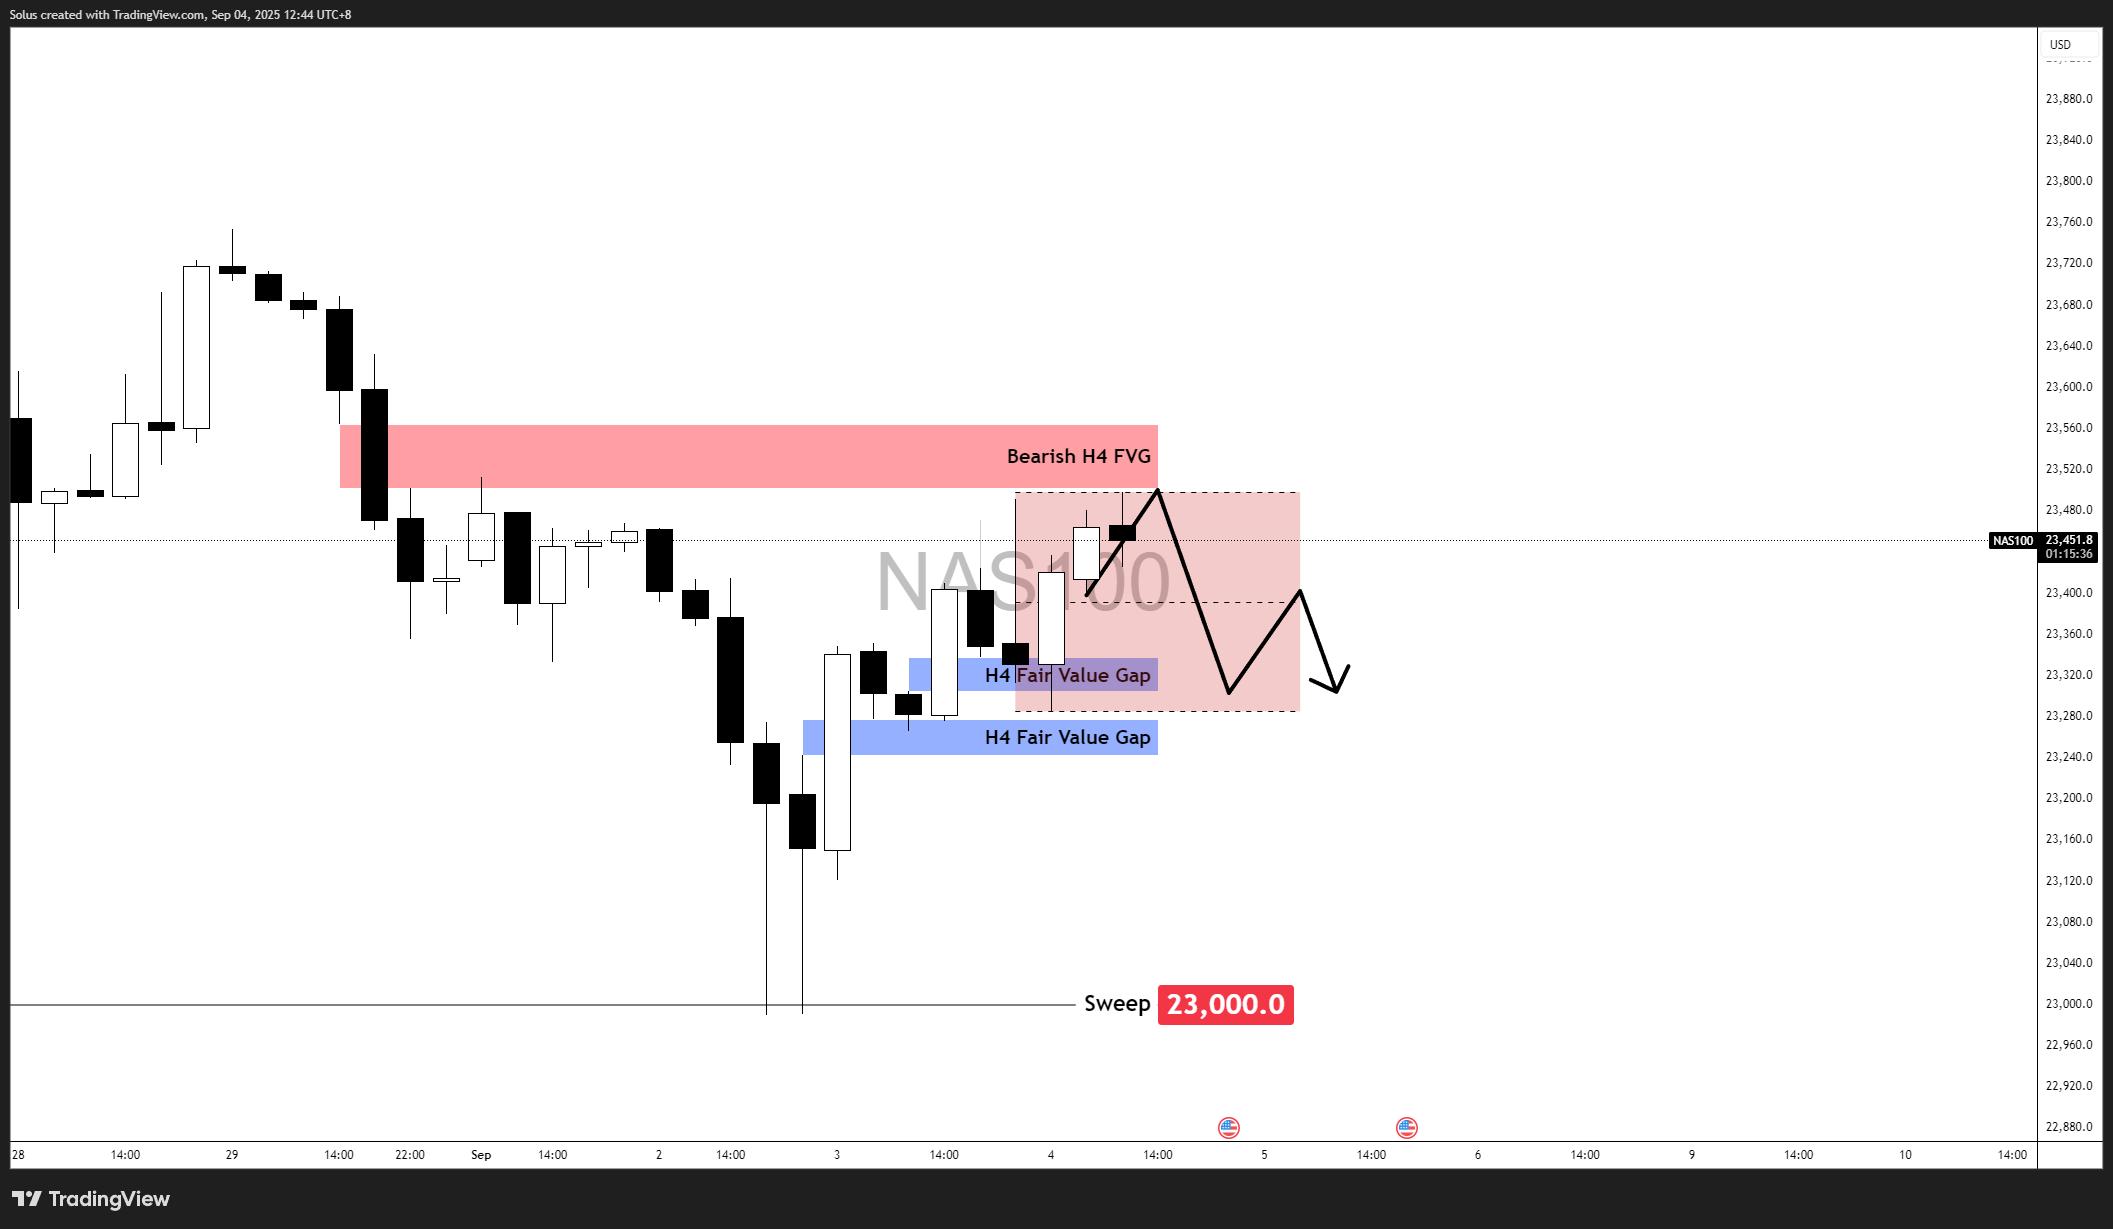
If sellers defend the 23,500–23,550 zone, Nasdaq could fail to build momentum and turn lower. This scenario reflects distribution at premium pricing after the liquidity sweep.
It’s time to go from theory to execution - risk-free.
Create an Account. Start Your Free Demo!
Looking for step-by-step approaches you can plug straight into the charts? Start here:
Sharpen your edge with proven tools and frameworks:
News moves markets fast. Learn how to keep pace with SMC-based playbooks:
From NASDAQ opens to DAX trends, here’s how to approach indices like a pro:
Gold remains one of the most traded assets - - here’s how to approach it with confidence:
Candlesticks are the building blocks of price action. Master the most powerful ones:
Ready to go intraday? Here’s how to build consistency step by step:
Markets swing between calm and chaos. Learn to read risk-on vs risk-off like a pro:
Step inside the playbook of institutional traders with SMC concepts explained:
Forex pairs aren’t created equal - - some are stable, some are volatile, others tied to commodities or sessions.
If you’ve ever been stopped out right before the market reverses - - this is why:
Mindset is the deciding factor between growth and blowups. Explore these essentials:
The real edge in trading isn’t strategy - - it’s how you protect your capital:
If you’re not sure where to start, follow this roadmap:
This way, you’ll grow from foundation → application → mastery, instead of jumping around randomly.
Follow me for more daily market insights!
Jasper Osita - LinkedIn - FXStreet - YouTube
This content may have been written by a third party. ACY makes no representation or warranty and assumes no liability as to the accuracy or completeness of the information provided, nor any loss arising from any investment based on a recommendation, forecast or other information supplies by any third-party. This content is information only, and does not constitute financial, investment or other advice on which you can rely.
ACY Securities is one of Australia's fastest growing multi-asset online trading providers, offering ultra-low-cost trading, rock-solid execution, technologically superior account management and premium market analysis.
Select the categories and companies you wish to follow directly to your person rss feed.
Create Custom RSS FeedSign up and join over 5,000 professional members who receive personalized news alerts, curated professional connections, and more for free!
Retail futures trading leader NinjaTrader Group has appointed Mark Omens as Senior Vice President, Commercial Strategy, bringing a 25-year veteran of derivatives marketplace CME Group into a newly created role focused on exchange partnerships and enterprise growth.
Gold Price Action Forecast: Will XAU/USD Drop to $3930? Meta Description: Read our Gold price action forecast to see if XAU/USD will drop to $3930.
BitDelta Securities Financial Services LLC (“BitDelta Securities”) today announced that it has received full regulatory approval from the Capital Market Authority (“CMA”) of the United Arab Emirates under the Category 5 — Arrangement and Advice license framework (License No. 20200000439). The approval follows the firm's receipt of In-Principal Approval earlier this year and represents the successful conclusion of the CMA's full licensing process, including the satisfaction of capital requirements, governance appointments, and operational setup.
Crypto.com has received a $400 million strategic investment from Citadel Securities, valuing the firm at $20 billion. It marks the first institutional funding round in the company's history, aimed at accelerating its expansion into tokenised securities, derivatives and other asset classes.
WTI’s pullback into $79–82 is the first major test of the bullish Elliott Wave count, with buyers targeting a renewed break above $85.

BitDelta Securities has secured a full CMA Category 5 licence in the UAE and opened a regulated office in Business Bay, Dubai. The firm operates as an introducing broker, connecting investors with licensed international brokers across multiple asset classes, with CEO Dr. Demetrios Zamboglou commenting on the milestone.
Index volatility is asleep while single stocks fight it out underneath, credit refuses to confirm the equity rally, and a bare macro calendar hands next week to oil.
Digital assets and FX brokerage GC Exchange FZE (GCEX) has appointed Mohammed A. Mulla as a Board Member of its Dubai-based entity, part of the wider GCEX Group.
Learn what Blockchain-as-a-Service is, how it works, and why businesses are using BaaS to build blockchain applications without managing infrastructure.
CFDs vs stocks compared on leverage, ownership, costs, dividends, taxes, and risk. Learn the differences between stocks and CFDs and discover which suits your investing or trading goals.


