just now


Liquidity Finder Ltd is incorporated in England and Wales, company number 10610740, registered address 167-169 Great Portland Street, Fifth Floor, London W1W 5PF, United Kingdom.
Published: just now

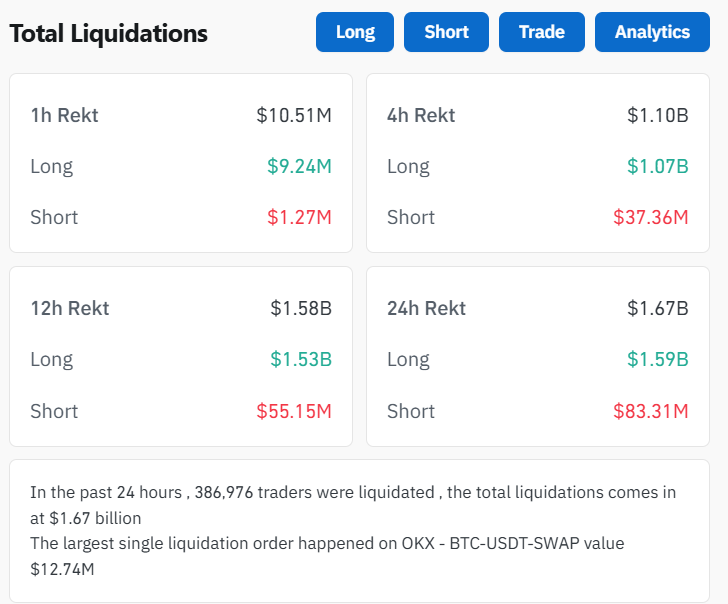
According to Coinglass’s liquidation tracker, roughly $1.59B in long positions were wiped out today — proof that retail apes who chased weekend highs got caught on the wrong side.
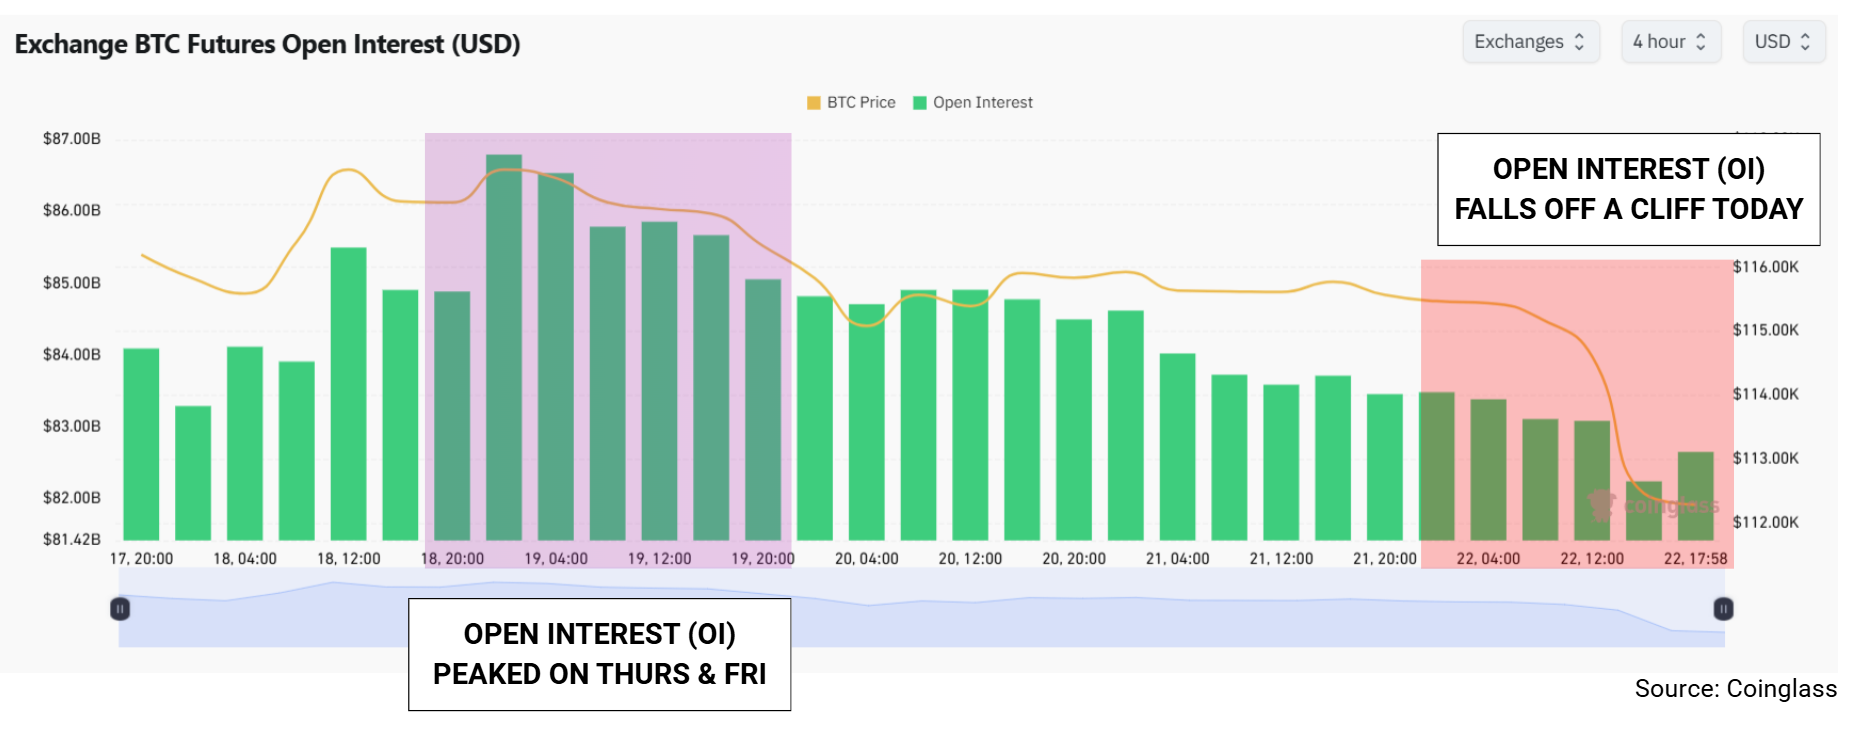
At the same time, open interest has rolled over rapidly today, underscoring a classic leverage washout. It’s the kind of reset that clears out weak hands and forces the market back to neutral.
So will Bitcoin’s bullish rally continue?
While long term structures are not threatened, short term signals are mixed. Let’s dive in.
SHORT TERM MARKET STRUCTURE IS MIXED
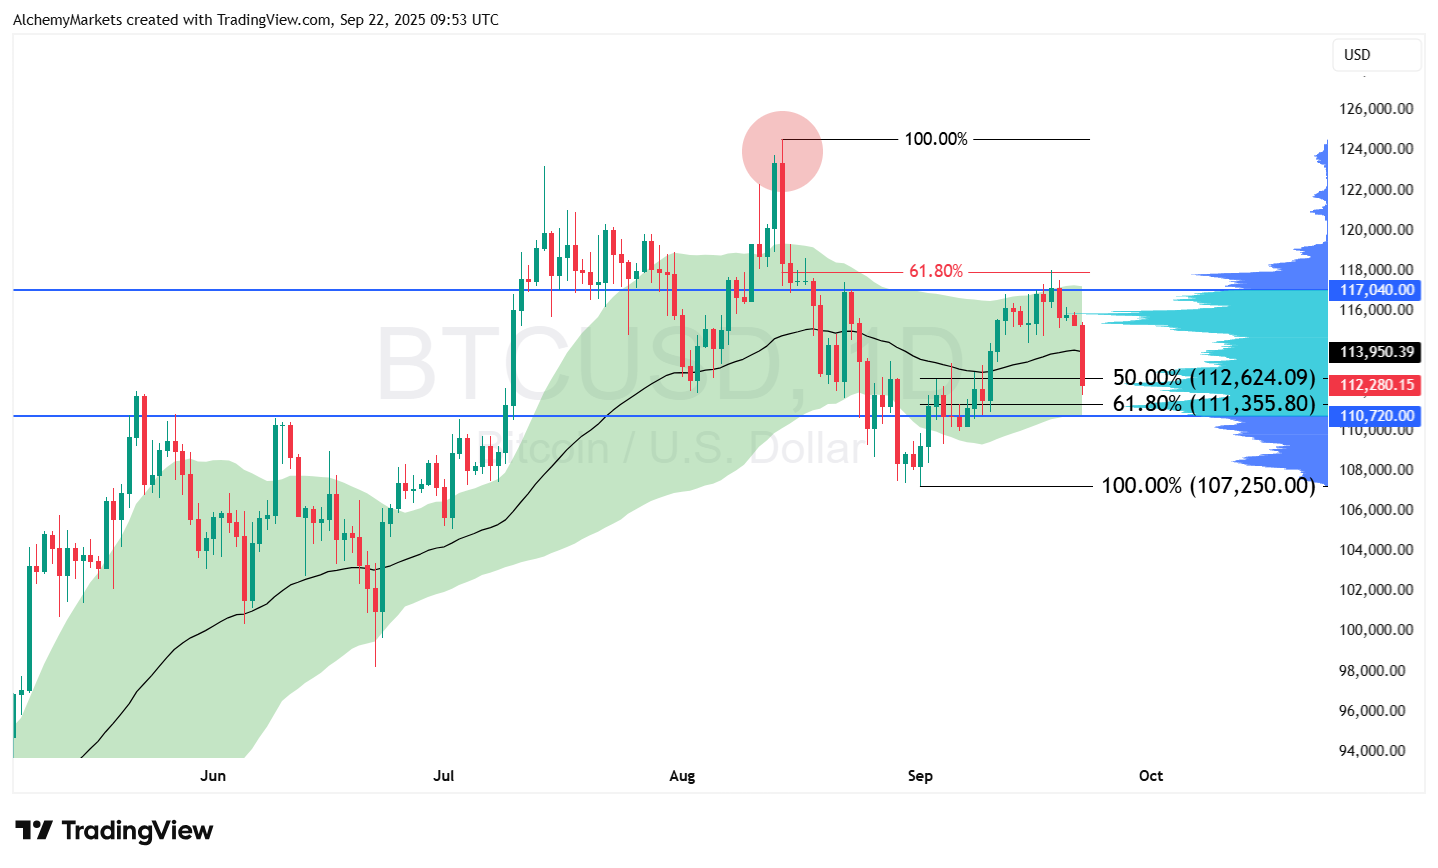
Bitcoin rejected at the 61.8% bearish Fibonacci retracement, forming a lower high. That’s a bearish warning. But so far, the price hasn’t printed a clean lower low — so the structure hasn’t fully rolled over.
EMA BAND TREND ANALYSIS
The daily 50-EMA band (±1 stdev) is holding up as dynamic support. Historically this band has performed as a decent safety net.
If Bitcoin holds above $110,720 (lower stdev of 50-EMA), bulls have room to push towards the 50 EMA near $113,955, and maybe even to the value area high at $117,040.
If the band gives way, BTC likely slides to retest $107,250, the August low. That would confirm the late-August breakdown as a trend shift.
Note: The volume profile here is anchored to August highs, marked by the red dot.
IMMEDIATE SUPPORT LEVELS
BTC is sitting right at two critical Fib retracements, both overlapping with high-volume nodes on the anchored volume profile (set from the August 14th peak):
These zones could generate a bullish reaction due to their historical volume and fibonacci significance, but beyond that, we have $110,720 — which is the bottom of the 50-EMA band and the value area low.
Lose that area, and Bitcoin could see deeper corrections towards even the $97K.
Was there a leverage flushout? Yes — $1.59B in long liquidations confirms it.
Is it over? Not yet. BTC needs to defend the Fib + EMA confluence around $111–$112k.
Scenarios:
This flushout may have flushed out weak hands, but whether it marks a bottom depends entirely on how Bitcoin reacts at these nearby supports. The critical deciding factor is that Bitcoin holds the bottom of the green bands on the daily timeframe, and that aligns with the value area low of $110,720.
You may also be interested in:
September Cut Signals 3-Rate Path as DXY Faces EMA Barrier
DISCLAIMER: For educational purposes only. Trading comes with substantial risk, leading to possible loss of your capital. Traders are advised to do their own due diligence before investing.
Alchemy Markets is a multi-asset brokerage providing retail traders with the same elite trading conditions, tools, and transparency typically reserved for institutions.

Select the categories and companies you wish to follow directly to your person rss feed.
Create Custom RSS FeedSign up and join over 5,000 professional members who receive personalized news alerts, curated professional connections, and more for free!
FM Summit London 2026 returns to Old Billingsgate on 24 November for its 15th edition, with LMAX Group, Plus500 and oneZero among confirmed exhibitors. The one-day event adds Business Connect meetings and roundtables, and opens with a networking evening at The Folly on 23 November.
Finance Magnates Summit London returns to Old Billingsgate on 24 November 2026 for its 15th edition. The one-day event brings together brokers, liquidity providers, institutional firms, trading technology vendors, payments businesses and digital asset firms.
iSAM Securities Apex has integrated with Match-Prime, giving brokers access to liquidity across more than 2,000 instruments, with tailored pricing and up to 10 levels of market depth.
propfunding.com's free-entry instant funding changes the order of prop funding. Start trading first. Its free-entry instant funding model offers two qualification attempts without an upfront activation fee.
US stocks closed higher on Wednesday, with the Nasdaq gaining 1%, the S&P 500 rising 0.6%, and the Dow advancing 0.7%, as renewed enthusiasm for AI-related stocks lifted market sentiment.
SpaceX went public in June as a rocket company. On October 20 it reported as something else entirely: an AI infrastructure business, financed by a satellite broadband network, with a launch division attached. Rockets generated 12% of third quarter revenue and lost money. The AI segment generated 52% of revenue and consumed 84% of capital expenditure. Starlink generated 85% of operating profit.
Standard Chartered has signed definitive agreements to acquire 100% of Zodia Custody UK Limited, folding its regulated digital asset custody business into Securities Services. Zodia Solutions will be set up under SC Ventures with bank investors including Northern Trust, NAB Ventures, Emirates NBD and Investcorp.
Bybit Fintech FZE has secured a Virtual Asset Service Provider licence from Dubai’s Virtual Assets Regulatory Authority for Exchange Services, covering spot trading. Bybit’s Peter Loo said the firm hopes to add derivatives, subject to regulatory approvals. Its international Dubai headquarters opened in 2022.
ATFX Connect has released its Q4 2026 Institutional Edge, examining the geopolitical, monetary policy and fiscal pressures shaping global financial markets in the final quarter of the year.
The Nasdaq 100 is trading at 29,382. After reaching a recent high of 29,957, the index reversed sharply and has been recording a series of lower highs and lower lows.