just now

Liquidity Finder Ltd is incorporated in England and Wales, company number 10610740, registered address 167-169 Great Portland Street, Fifth Floor, London W1W 5PF, United Kingdom.
Published: just now
Every successful swing trader carries a toolkit—not one made of wrenches and screwdrivers, but of charts, timeframes, and concepts that decode how institutions move the market. Your goal isn’t to predict every tick; it’s to align yourself with the flow of smart money across multiple timeframes. If you’ve never structured your workflow this way, start by studying multi-timeframe analysis in SMC to see how the Daily, 4H, and 1H each carry a job in your plan.
In this part of the Swing Trading Series, we’ll sharpen your edge using multi-timeframe analysis, confluence zones, liquidity concepts, and Fair Value Gaps (FVGs) & Order Blocks (OBs) tailored for higher timeframe structures. Newer traders can pair this with a structured base like Forex Trading Strategy for Beginners so the ideas translate into step-by-step actions.
Swing traders are navigators of time.
Your daily chart shows the terrain, your 4-hour chart reveals the path, and your 1-hour chart gives the entry point. The workflow is simple: define bias on the Daily, map the pullback or continuation structure on 4H, then refine triggers on 1H.

If you want a deeper walk-through of this exact flow, keep this MTF guide handy while you chart.
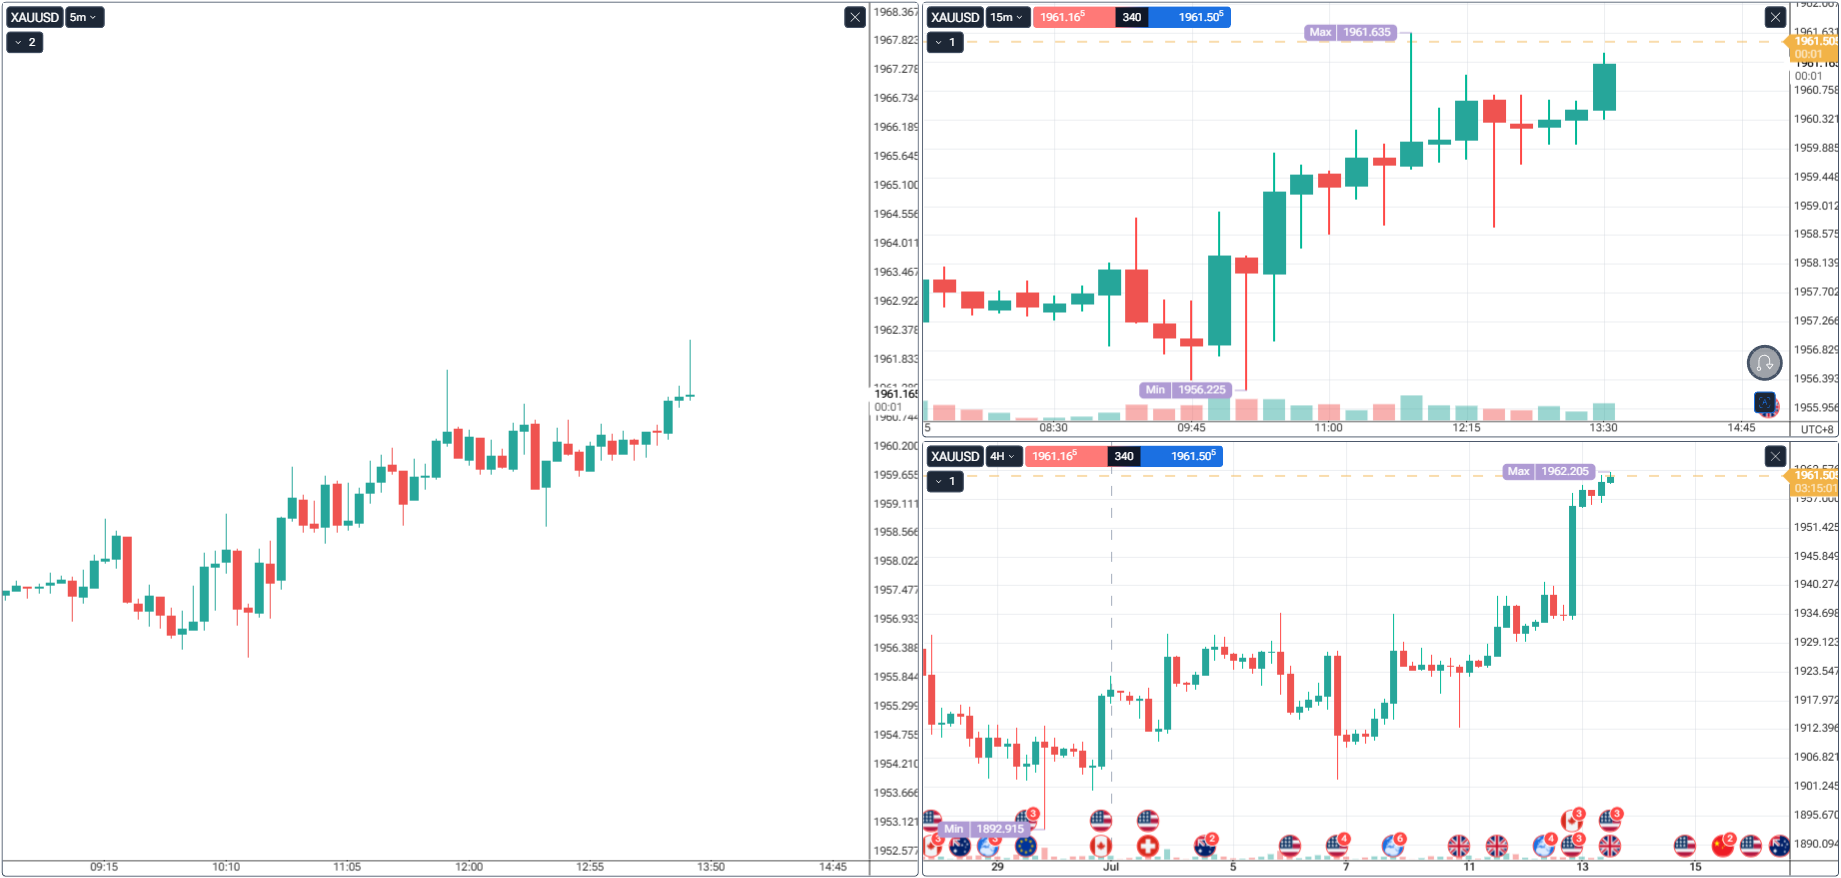
Confluence is where everything “clicks.” It’s when your higher timeframe structure, a prior order block, and a developing FVG sit in the same region—after a liquidity event. That’s stacked probability, not hope. If you prefer rules over vibes, ground your selection process in how Smart Money Concepts actually work so your confluence checklist reflects real institutional behavior rather than random overlaps.
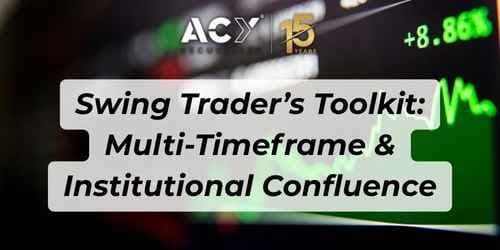
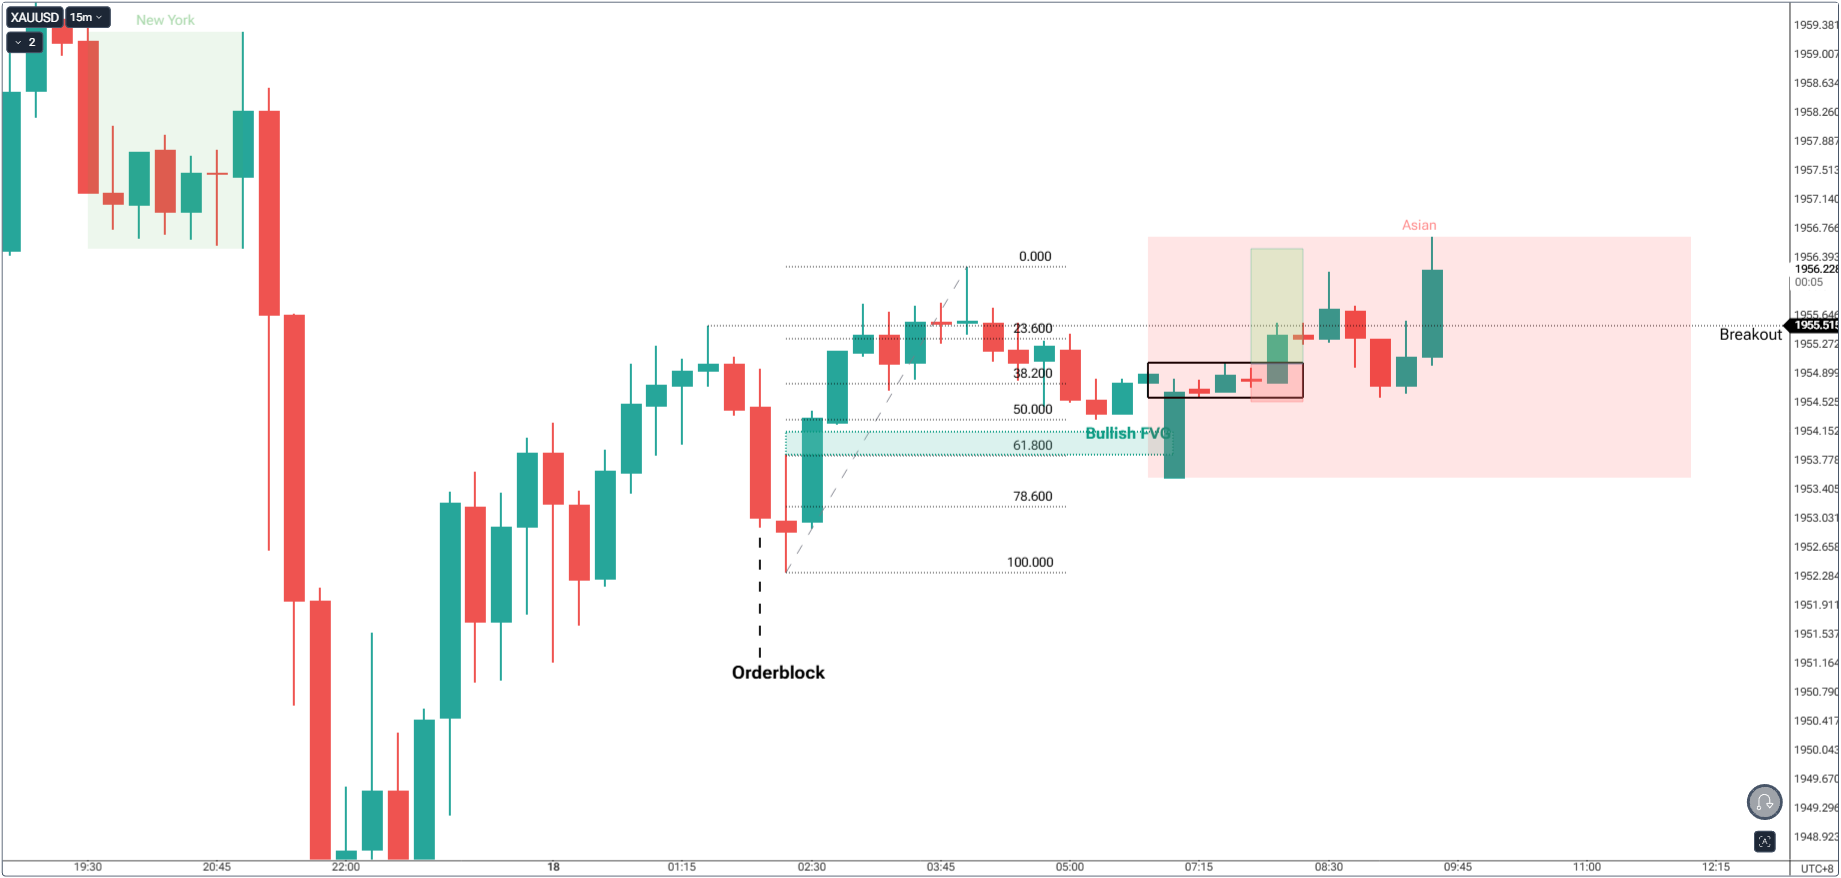
Higher Timeframe Context (4H)
Mid Timeframe Confirmation (15M)
Entry Timeframe Precision (5M)
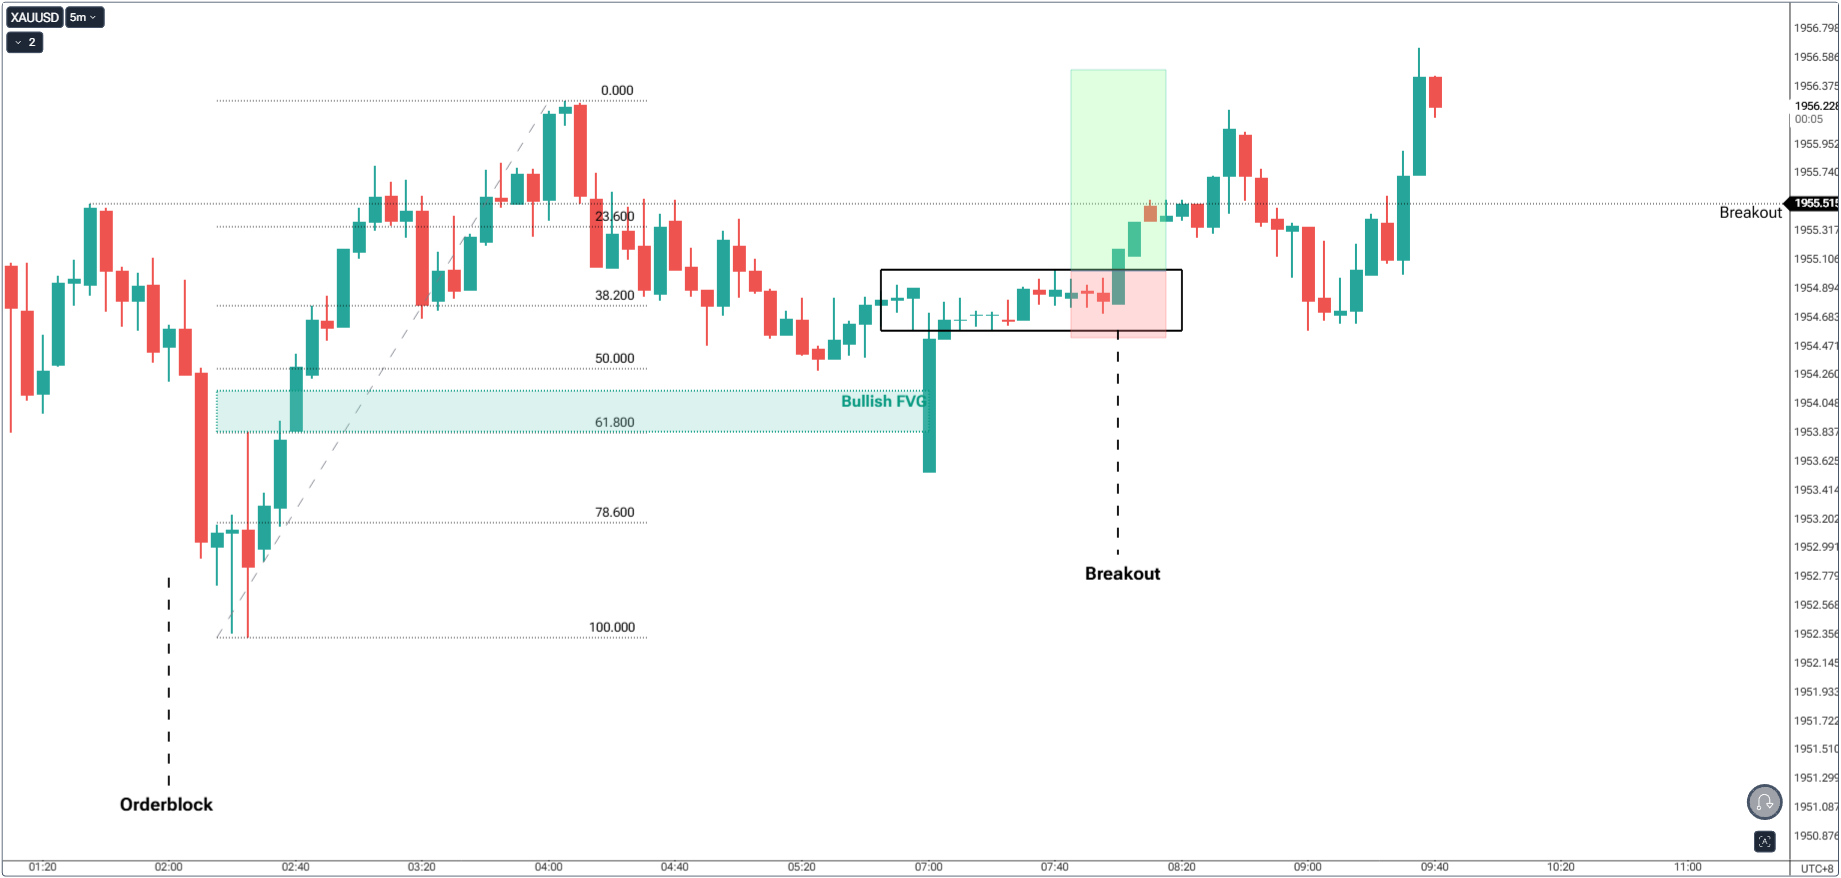

You’re not buying because the chart “looks bullish.”
You’re buying because:

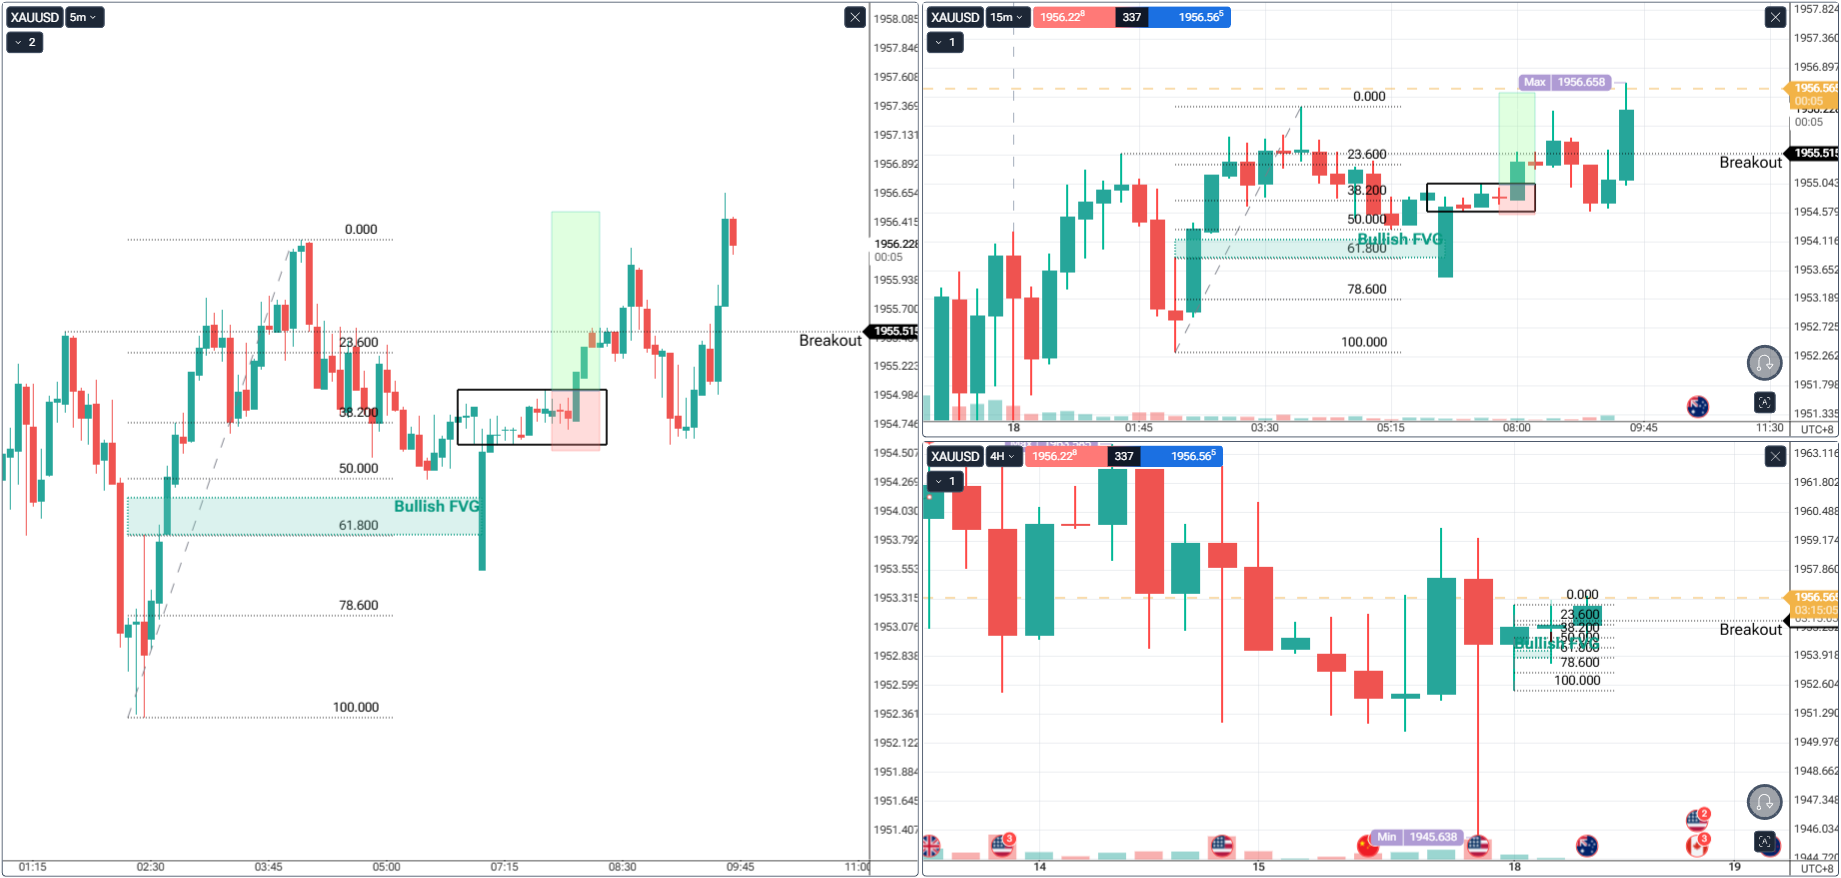
Institutions don’t chase obvious breakouts; they engineer them to harvest stops. Equal highs/lows and crisp trendlines become liquidity shelves. When price wicks through a well-advertised high and fails to continue, it often signals the “fill” phase before reversal or continuation. To see these footprints with clarity, review liquidity sweeps in SMC and practice distinguishing genuine displacement from head-fakes.
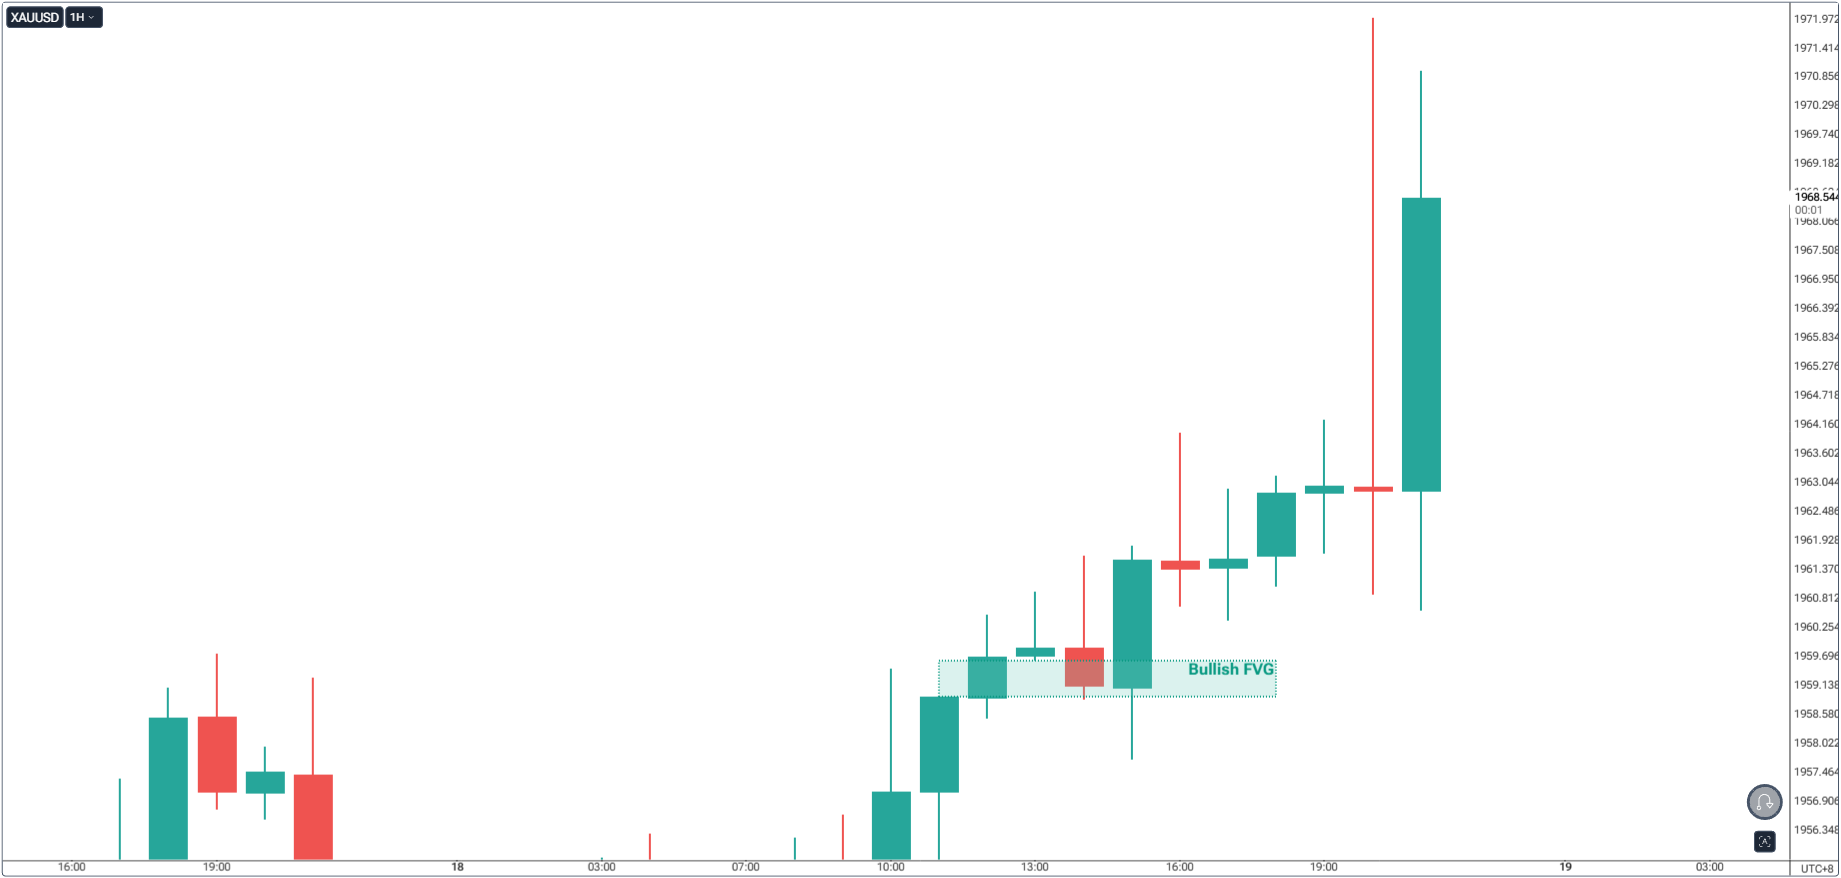
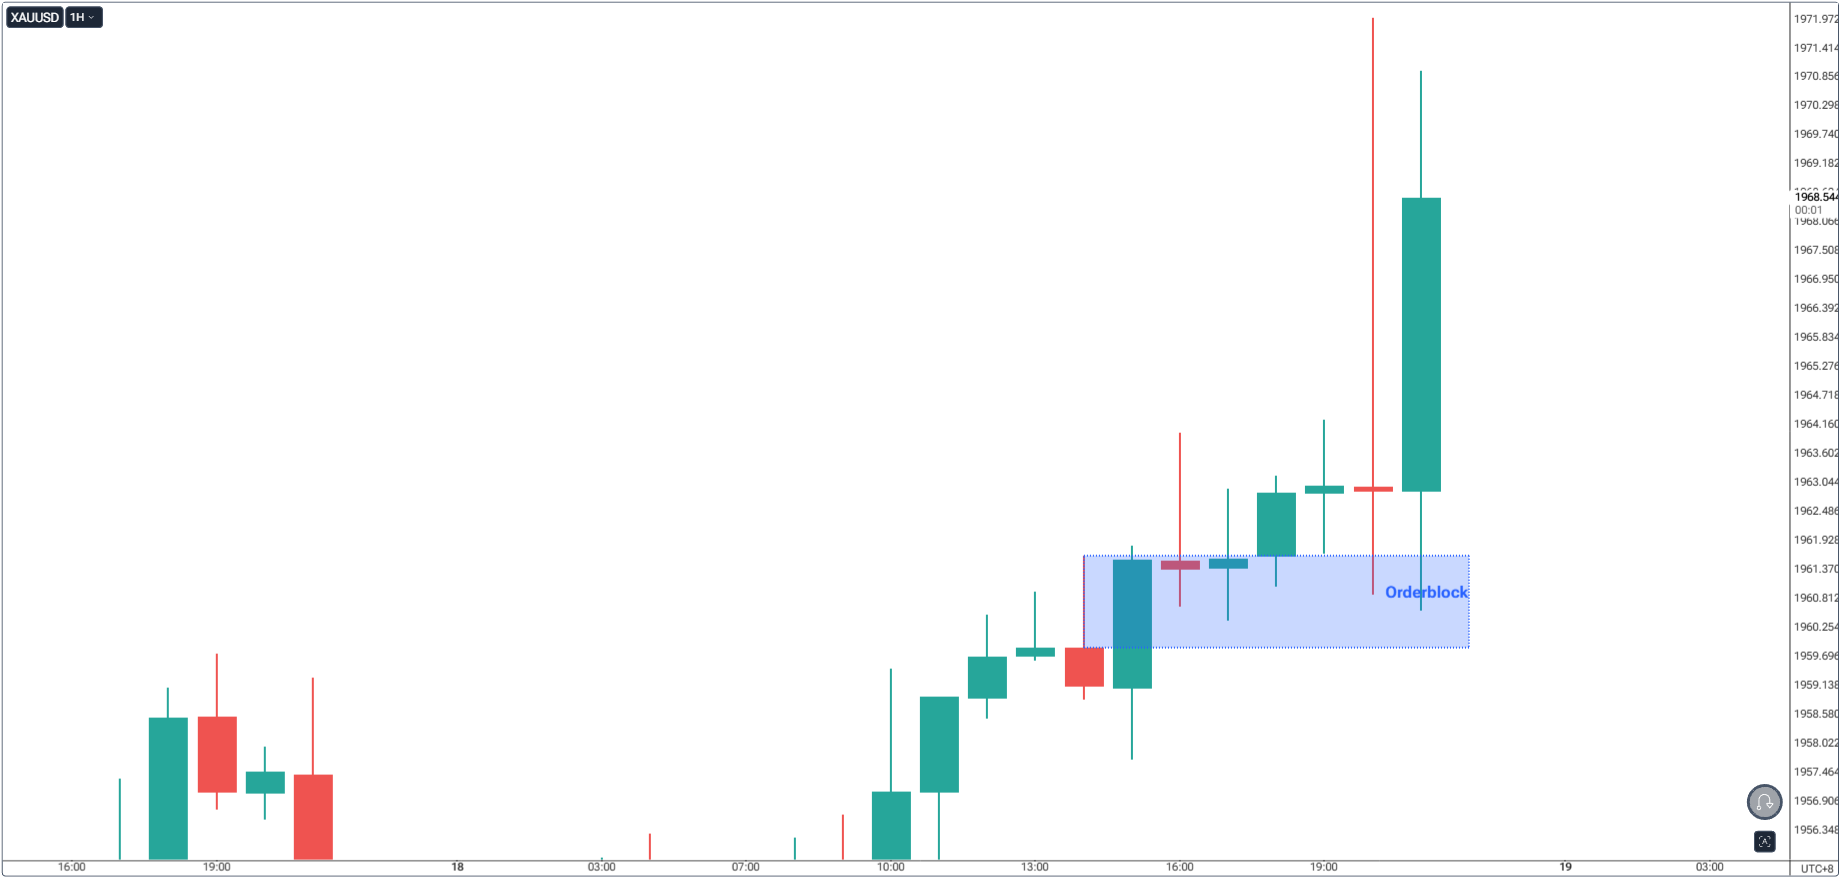
On higher timeframes (4H/D/W), these zones can act like institutional footprints. Your best swing entries come from trading from these zones, not into them. When in doubt, revisit Fair Value Gaps Explained to keep your markings consistent and avoid bloated, ambiguous boxes.
A pro architect doesn’t start hammering nails randomly. They study the master plan, check load-bearing points, and align angles before a single cut. The Daily is your blueprint, 4H is your frame, and 1H is your finishing work. Skip one, and the structure warps—even if it looks pretty at first.
The swing trader toolkit is less about collecting tools and more about sequencing them: bias → liquidity → zone → trigger → risk. Keep your blueprint (Daily), framework (4H), and finishing work (1H) talking to each other. When they agree—and only then—execute with clarity.
If you want to see these ideas in live market form, pair this with multi-timeframe SMC examples and a refresher on why SMC works. For newcomers building structure, this beginner’s strategy path will keep you grounded.
Daily–4H–1H provides a clean chain from bias → structure → execution.
No. Price action, structure, and liquidity are sufficient—add tools only if they clarify, not clutter.
It should be tied to a clear break of structure and ideally sit after a liquidity event. Use the FVG primer for consistency.
At the center. Position sizing and stop placement turn good ideas into sustainable results; lock in a plan with this risk management compilation.
It’s time to go from theory to execution - risk-free.
Create an Account. Start Your Free Demo!
Looking for step-by-step approaches you can plug straight into the charts? Start here:
Sharpen your edge with proven tools and frameworks:
News moves markets fast. Learn how to keep pace with SMC-based playbooks:
From NASDAQ opens to DAX trends, here’s how to approach indices like a pro:
Gold remains one of the most traded assets - - here’s how to approach it with confidence:
Candlesticks are the building blocks of price action. Master the most powerful ones:
Ready to go intraday? Here’s how to build consistency step by step:
Markets swing between calm and chaos. Learn to read risk-on vs risk-off like a pro:
Step inside the playbook of institutional traders with SMC concepts explained:
Forex pairs aren’t created equal - - some are stable, some are volatile, others tied to commodities or sessions.
If you’ve ever been stopped out right before the market reverses - - this is why:
Mindset is the deciding factor between growth and blowups. Explore these essentials:
The real edge in trading isn’t strategy - it’s how you protect your capital:
If you’re not sure where to start, follow this roadmap:
This way, you’ll grow from foundation → application → mastery, instead of jumping around randomly.
Follow me for more daily market insights!
Jasper Osita - LinkedIn - FXStreet - YouTube
This content may have been written by a third party. ACY makes no representation or warranty and assumes no liability as to the accuracy or completeness of the information provided, nor any loss arising from any investment based on a recommendation, forecast or other information supplies by any third-party. This content is information only, and does not constitute financial, investment or other advice on which you can rely.
ACY Securities is one of Australia's fastest growing multi-asset online trading providers, offering ultra-low-cost trading, rock-solid execution, technologically superior account management and premium market analysis.
Select the categories and companies you wish to follow directly to your person rss feed.
Create Custom RSS FeedSign up and join over 5,000 professional members who receive personalized news alerts, curated professional connections, and more for free!
Sterling steadies after political uncertainty rattled gilt markets, while EUR/USD and EUR/GBP approach key technical levels ahead of today's European session.
GBP/AUD remains trapped in a well-defined bearish trend on both the weekly and daily timeframes.
Discover the key drivers, technical levels, and central bank expectations shaping the EUR/USD trend as the ECB prepares to hold rates and markets watch for a potential breakout.
Sydney-based multi-asset broker ACY Securities has introduced PAXGUSD, a new CFD instrument that allows clients to trade tokenised gold against the US Dollar 24 hours a day, seven days a week. The instrument is available across MetaTrader 4, MetaTrader 5, and the ACY Trading Platform.
Binance has lowered its VIP 3 Wallet Assets threshold from $3 million to $1 million and will now count OTC Spot Trading Volume at a 4x multiplier toward VIP qualification, removing the previous VIP 4 cap and allowing eligible users to progress through the full tier framework up to VIP 9.
Retail futures trading leader NinjaTrader Group has appointed Mark Omens as Senior Vice President, Commercial Strategy, bringing a 25-year veteran of derivatives marketplace CME Group into a newly created role focused on exchange partnerships and enterprise growth.
Gold Price Action Forecast: Will XAU/USD Drop to $3930? Meta Description: Read our Gold price action forecast to see if XAU/USD will drop to $3930.
BitDelta Securities Financial Services LLC (“BitDelta Securities”) today announced that it has received full regulatory approval from the Capital Market Authority (“CMA”) of the United Arab Emirates under the Category 5 — Arrangement and Advice license framework (License No. 20200000439). The approval follows the firm's receipt of In-Principal Approval earlier this year and represents the successful conclusion of the CMA's full licensing process, including the satisfaction of capital requirements, governance appointments, and operational setup.
Crypto.com has received a $400 million strategic investment from Citadel Securities, valuing the firm at $20 billion. It marks the first institutional funding round in the company's history, aimed at accelerating its expansion into tokenised securities, derivatives and other asset classes.
WTI’s pullback into $79–82 is the first major test of the bullish Elliott Wave count, with buyers targeting a renewed break above $85.


