just now


Liquidity Finder Ltd is incorporated in England and Wales, company number 10610740, registered address 167-169 Great Portland Street, Fifth Floor, London W1W 5PF, United Kingdom.
Published: just now

BitDelta Pro
What to expect from Q4?
Research | October 5, 2026
The consensus entering Q4 is that rising yields are a warning sign. That the bond market is telling you something. It is. It is telling you that demand is extraordinary. This outlook examines four asset classes through a single lens: what happens when yields rise because the economy is hot, not because it is breaking.
The answer is not uniform. Rates remain structurally elevated, supported by three mechanical forces unrelated to fiscal panic. Equities climb because cash flow growth outpaces the discount rate. Commodities correlate positively with yields because the same demand driving rates higher is driving physical consumption. And gold, the traditional crisis hedge, is under pressure precisely because this is not a crisis.
| Asset Class | Current Level | Q3 Move | Yield Correlation | Q4 Thesis |
| 10Y UST Yield | 5.246% | +80-100bps | -- | Structurally elevated |
| S&P 500 | 7,500-7,700 | Positive | Growth > cost of capital | Numerator winning |
| Brent Crude | $104-108/bbl | Elevated | Positive | Supply + demand bid |
| WTI Crude | $90 -$105/bbl | Elevated | Positive | Supply + demand bid |
| Silver | ~$61.00/oz | +7.5% | Positive (industrial) | Industrial + monetary bid |
| Gold | ~$4,181/oz | -26% from peak | Inverse (reasserting) | Yield gravity, CB floor |
Source: TreasuryDirect, TradingView, Kpler, ISM. Data as of September 30, 2026.
Rates: Three Structural Tailwinds
The 10-year closed September at 5.218%. The 30-year cleared its auction at 5.308%. The 2-year is approaching 5%, producing a bear flattener with a spread of roughly 13 basis points. Highest sustained yields since 2001. The reflexive interpretation is that something is wrong. The reflexive interpretation is incomplete.
Off-the-run rotation. Holders of ZIRP-era Treasuries, bonds carrying sub-1% coupons purchased at par, are sitting on instruments trading at roughly 70 cents on the dollar. The math is simple: sell the discounted bond, take the capital loss (a tax event), redeploy into new-issue paper yielding 4.8%+. The yield pickup is permanent. This creates mechanical selling pressure independent of macro sentiment, fiscal policy, or the Fed, and it persists until the stock of legacy low-coupon bonds is substantially reduced.
TGA and issuance dynamics. The Treasury General Account stood at $945 billion as of September 25, approximately 59% of its 2021 peak of $1.6 trillion. The Fed continues rolling off notes and bonds while Treasury concentrates buybacks in shorter-duration bills. Net effect: supply constriction at the long end that receives less attention than headline deficit figures suggest. Yields are high because demand for capital exceeds available supply at these maturities, not because buyers are disappearing.
The PMI feedback loop. September flash PMI printed 57.0 Manufacturing and 58.4 Composite, both multi-year highs. ISM August showed 15 of 17 manufacturing industries expanding. The sectors driving this are not consumer discretionary or housing. They are transportation equipment (defense/NATO), computer and electronics (hyperscaler AI capex), machinery (reshoring), and metals (derived input demand). The transmission runs: expanding manufacturing generates high-wage employment, those wages flow into services spending (recreation 4.1%, transport 3.3%, healthcare 4.2%), services inflation feeds Core PCE at 3.3% YoY, and yields reflect the result.
What the Auctions Actually Show
| Maturity | Date | High Yield | Coupon | Bid-to-Cover | Indirect % |
| 10-Year Note | Sep 9 | 4.834% | 4.625% | 2.71 | 79.2% |
| 30-Year Bond | Sep 10 | 5.308% | 5.125% | 2.61 | 79.5% |
| 20-Year Bond | Sep 15 | 5.420% | 5.125% | 2.57 | 52.5% |
| Aug 30-Year (Comp.) | Aug 14 | 5.216% | -- | 2.39 | 11.5% (PD) |
Source: TreasuryDirect auction results. PD = Primary Dealer absorption.
The 10-year and 30-year auctions cleared with indirect bidder participation near 79%. These are foreign central banks and institutional accounts choosing to allocate at 5%+. Compare the September 30-year (2.61 bid-to-cover, 79.5% indirect) with August (2.39 BTC, 11.5% primary dealer absorption). Demand improved as yields rose. That is a market repricing to clear, not a market in distress.
Equities: The Numerator Is Winning
The equity market's resilience at 5%+ yields confuses observers who frame rate increases as unambiguously negative for stocks. The confusion is an incomplete application of DCF mechanics. Equity value is a function of two variables: the discount rate (WACC, the denominator) and the growth rate of future cash flows (g, the numerator). When both move, direction depends on which moves faster.
The denominator is clearly rising. The 10-year, a key WACC input, has gone from the low 4s to above 5.2% in Q3. But the numerator is growing faster. The same forces driving yields higher, the manufacturing expansion across defense, AI infrastructure, reshoring, and energy security, are generating the cash flow growth that supports valuations. When Lockheed books a $3 billion NATO order, that is simultaneously inflationary (PMI expansion, yield pressure) and accretive to defense sector cash flows. When NVIDIA ships $25 billion in data center GPUs per quarter, that flows through to hyperscaler capex (inflationary) and to earnings growth (supportive). This is a single economy where the same demand impulse drives both sides of the equation.
Critically, this demand is global. NATO procurement, Saudi Vision 2030, India's PLI manufacturing buildout, hyperscaler construction in Virginia, Dublin, Singapore, and the Gulf. Global capex driven by strategic imperatives, defense, energy independence, AI infrastructure, supply chain resilience, operates on a different framework than domestic consumption. A NATO member does not cancel a fighter jet order because the 10-year moved from 4.5% to 5.2%.
The bear case, stated honestly: the risk is not that yields are high. It is that g (growth of earnings/FCF) decelerates while r (cost of capital) continues to climb. If manufacturing expansion cools from an exogenous shock, geopolitical de-escalation, or capex cycle completion, the numerator shrinks while the denominator stays elevated. Multiples already embed significant growth expectations. Monitor PMI trajectory and guidance revisions. As long as the ISM PMI stays above 55 with broad participation, the numerator has the edge.
Commodities: The Positive Correlation
The assumption that rising yields are negative for commodities is wrong in a demand-driven regime. In supply-shock inflation, central banks raise rates to destroy demand, and commodities fall. In demand-driven reflation, the correlation flips: higher demand drives both commodity consumption and interest rates simultaneously.
The current cycle is unambiguously demand-driven for physical commodities. Copper at $6.58/lb reflects the electrical intensity of AI data center construction, global defense infrastructure, and India's manufacturing buildout. Brent at $104-108/bbl reflects both the geopolitical supply premium from Strait of Hormuz disruptions and diesel demand from an industrial economy running at PMI 57. Silver at $75.50, up 7.5%, is pulled by industrial applications in solar, electronics, and EV components as much as monetary properties.
The transmission is direct: higher industrial production generates physical demand for raw materials while simultaneously generating employment, wages, spending, inflation, and yield support. At no point does a higher yield reduce physical commodity demand, because the demand is driven by real activity, not financial arbitrage. Saudi crude exports recovered to 16,972 kbpd in September (93.7% of January baseline) through CENTCOM escorts, STS transfers, and East-West Pipeline diversification. The structural oil glut risk by late 2027 is worth monitoring (high-price overproduction, potential Iranian supply, weaker Chinese demand), but for Q4 the geopolitical premium and industrial demand keep prices supported.
Gold: The Exception That Proves the Rule
Gold is down approximately 26% from its February peak near $5,500, currently at $4,181/oz. This drawdown has occurred over exactly the period yields have ripped from the low 4s to above 5.2%. The traditional inverse correlation between gold and real yields, which many analysts declared dead earlier this year, has reasserted itself with force.
The mechanics are straightforward. Gold is a zero-yield asset. When the 30-year Treasury offers 5.3% with no default risk, the opportunity cost is explicit: a $1 million gold allocation generates zero income; the same in a 30-year Treasury generates $53,000 per year, locked in for three decades. The auction data reinforces this. When 79.5% of a 30-year auction is taken by indirect bidders at 5.308%, that is real capital choosing duration over zero-yield alternatives. This is particularly attractive for institutions who have payment obligations (i.e. insurance companies/pension funds).
Gold is not in freefall because central banks in China, India, Turkey, and across emerging markets continue accumulating as reserve diversification. This buying is geopolitically motivated and price-insensitive. It establishes a floor but cannot overcome yield gravity at 5%+. The result: range-bound to lower, supported by sovereign accumulation, capped by opportunity cost.
Gold's drawdown confirms the macro thesis. In a crisis, rising yields and rising gold coexist. In a demand cycle, capital flows toward income-generating and activity-reflecting assets, and gold loses the allocation fight. The reversal signal is a genuine crisis: a failed auction (not a weak one), a supply-threatening geopolitical escalation, or a credit event triggering flight-to-safety. None are base case for Q4.
Q4 Positioning
Rates: Structurally supported by the three forces above. Tactical yield compressions on de-escalation or soft PCE prints are trading opportunities, not trend reversals. The structural 10-year floor is significantly above 4%.
Equities: The g > r framework favors continued strength in defense/aerospace, AI infrastructure (semis, cloud, data center REITs), industrials, and energy infrastructure. Cost-of-capital-sensitive sectors (unprofitable growth, CRE, rate-sensitive consumer discretionary) face headwinds. This is a rotation cycle, not a broad repricing.
Commodities: Positive yield-commodity correlation favors copper, silver (industrial demand), and energy. Industrial metals remain the cleanest expression of the demand thesis.
Gold: Path of least resistance is lower. Central bank floor prevents collapse, yield gravity caps upside. Tactical rallies on geopolitical flare-ups are selling opportunities. The structural case re-emerges only when real yields compress meaningfully, which requires a recession or dramatic disinflationary shock. Neither is base case.
The fear of 5% yields is rational if you assume yields are rising because something is breaking. It is irrational if you examine why they are rising. The economy is generating demand at a pace that the bond market, equity market, and commodity market are all reflecting accurately. Gold is confirming the thesis from the other side. This is a demand cycle, and the rates fear is a feature of the cycle.
Disclaimer
This document is for informational and educational purposes only and does not constitute investment advice, a solicitation, or a recommendation to buy or sell any security or financial instrument. All data sourced from public filings, government releases, and third-party providers as cited. Forward-looking statements reflect the author's analysis as of the publication date and are subject to revision. Past performance is not indicative of future results.
BitDelta Securities Financial Services LLC, regulated by the Capital Market Authority under Category 5 (Introduction Only), acts solely as an introducer and does not provide trading, execution, dealing, advisory, portfolio management, or custody services. All trading, execution, and investment-related services are provided by BitDelta Limited, Mauritius, a licensed Investment Dealer excluding underwriting. All trading and investments involve risk. The value of investments may fluctuate, and you may receive less than your initial investment.
The information contained in this article is provided for general informational purposes only and does not constitute financial, investment, legal, or professional advice, or a recommendation to buy, sell, or hold any financial product. Readers should seek independent professional advice and conduct their own due diligence before making any decisions. Neither the publisher nor the contributors accept liability for any loss arising from reliance on this content.
Institutional multi-asset market access across MT5 Ultency, CQG, Iress Pro and BitDelta Terminal, with transparent execution standards and global market coverage.

Select the categories and companies you wish to follow directly to your person rss feed.
Create Custom RSS Feed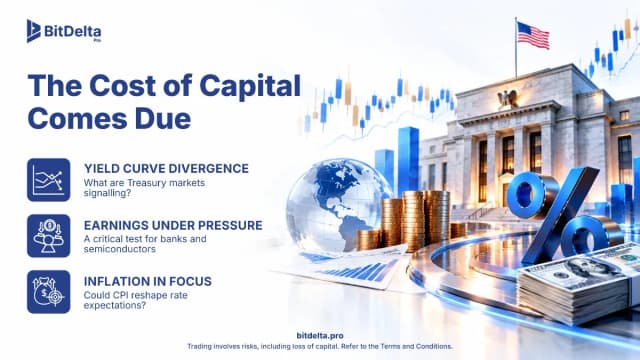
just now

just now
Sign up and join over 5,000 professional members who receive personalized news alerts, curated professional connections, and more for free!
Theorem has integrated Symbiotic’s Liquid Lane RFQ network, letting holders of tokenised real-world assets trade against on-chain pool liquidity and market-maker quotes. The integration is live on Ethereum, with Midas’s yield-bearing mHYPER fund as the first supported asset. Holders can trade for the USDC stablecoin.
US equities were volatile with technology selloff erasing much of the earlier rebound.
FM Summit London 2026 returns to Old Billingsgate on 24 November for its 15th edition, with LMAX Group, Plus500 and oneZero among confirmed exhibitors. The one-day event adds Business Connect meetings and roundtables, and opens with a networking evening at The Folly on 23 November.
Finance Magnates Summit London returns to Old Billingsgate on 24 November 2026 for its 15th edition. The one-day event brings together brokers, liquidity providers, institutional firms, trading technology vendors, payments businesses and digital asset firms.
iSAM Securities Apex has integrated with Match-Prime, giving brokers access to liquidity across more than 2,000 instruments, with tailored pricing and up to 10 levels of market depth.
propfunding.com's free-entry instant funding changes the order of prop funding. Start trading first. Its free-entry instant funding model offers two qualification attempts without an upfront activation fee.
US stocks closed higher on Wednesday, with the Nasdaq gaining 1%, the S&P 500 rising 0.6%, and the Dow advancing 0.7%, as renewed enthusiasm for AI-related stocks lifted market sentiment.
SpaceX went public in June as a rocket company. On October 20 it reported as something else entirely: an AI infrastructure business, financed by a satellite broadband network, with a launch division attached. Rockets generated 12% of third quarter revenue and lost money. The AI segment generated 52% of revenue and consumed 84% of capital expenditure. Starlink generated 85% of operating profit.
Standard Chartered has signed definitive agreements to acquire 100% of Zodia Custody UK Limited, folding its regulated digital asset custody business into Securities Services. Zodia Solutions will be set up under SC Ventures with bank investors including Northern Trust, NAB Ventures, Emirates NBD and Investcorp.
Bybit Fintech FZE has secured a Virtual Asset Service Provider licence from Dubai’s Virtual Assets Regulatory Authority for Exchange Services, covering spot trading. Bybit’s Peter Loo said the firm hopes to add derivatives, subject to regulatory approvals. Its international Dubai headquarters opened in 2022.