just now


Liquidity Finder Ltd is incorporated in England and Wales, company number 10610740, registered address 167-169 Great Portland Street, Fifth Floor, London W1W 5PF, United Kingdom.
Published: just now

The biggest macro events of Q3 are behind us. The Fed hiked 25 basis points to 3.75-4.00% in a unanimous vote. Jackson Hole delivered Warsh's framework. The Saudi East-West Pipeline was attacked and shut down. The 10-year and 30-year auctions cleared at generational yields with record bid-to-cover ratios. Oil broke $100.
The question now is not what the macro does. It is what individual companies do with it. The market has absorbed the rate hike, processed the oil shock, and repriced the yield curve. What comes next is sector-level and stock-level differentiation. The names with pricing power, domestic production, and earnings growth above the cost of capital get bid. Everything else gets sold. This week is when that sorting begins.
The Bull Flattener: What It Means and Who It Hurts
The yield curve has entered a bull flattener. The long end is dropping as inflation expectations moderate following the Fed's credibility-restoring hike. The short end is rising because the Fed just raised the overnight rate. The spread between the 30-year and the 2-year is compressing.
This curve shape has specific winners and losers.
Winners: The US government. Treasury is issuing primarily at the short end through the bills-over-bonds strategy. The long end coming down reduces the weighted average cost of new issuance even though the Fed just hiked. The TGA at $966 billion provides the ammunition for buyback operations on the long end. The combination of short-end issuance and long-end buybacks in a bull flattener is the ideal operating environment for Bessent's strategy. He could not have designed it better.
Losers: Banks, particularly regional banks. A flatter curve is the worst possible shape for bank profitability. Deposit costs rise immediately (they are linked to the short rate the Fed just raised). Lending rates do not rise commensurately because the long end is falling. Net interest margins compress. Money center banks can offset NIM compression with trading revenue, investment banking fees, and diversified business lines. Regional banks cannot. They earn the spread and the spread just shrank.
Mixed: Industrials. The sector has been sold indiscriminately on the macro narrative (rates up, tanker costs up, input costs up). The ETF selling doesn't distinguish between a commodity manufacturer with thin margins and a precision monopolist with pricing power and captive customers. Companies like Howmet Aerospace, which makes titanium and nickel superalloy components that every jet engine and data center cooling system requires, are being sold alongside generic industrial names despite having fundamentally different demand profiles. The macro selloff in industrials is creating dislocations between price and value that stock-level analysis can exploit.
The SEP: One-and-Done Then Cut
The Summary of Economic Projections released alongside the decision tells a specific story about the rate path that contradicts the ZQ pricing of four consecutive hikes.
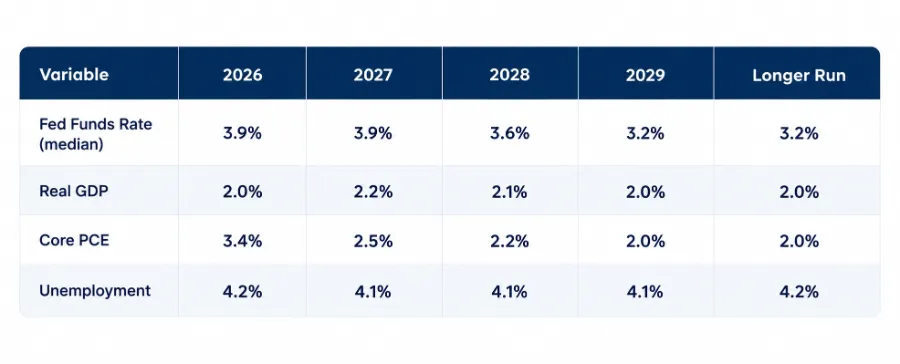
The median fed funds rate is 3.9% for both 2026 and 2027. That means the Fed's own members project HOLDING at 3.75-4.00% for the next year after this hike. Then cutting to 3.6% in 2028 and 3.2% in 2029. This is one-and-done followed by a gradual cutting cycle beginning in 2028.
The ZQ market is pricing four hikes in four meetings. The Fed's own median projection says zero additional hikes through 2027. Somebody is wrong. If the SEP is the better guide (and it usually is because it reflects the views of the people who vote), the market is over-pricing tightening by 75-100 basis points. That mispricing resolves as either the Fed hikes more than its own projection suggests (possible but inconsistent with the balance sheet easing in the implementation note) or the market reprices toward the SEP (more likely, and bullish for duration-sensitive assets when it happens).
Core PCE is projected to decline from 3.4% in 2026 to 2.5% in 2027 and reach the 2.0% target by 2029. The Fed is telling you it expects the inflation problem to resolve without additional hikes beyond this one. The supply shock from oil is treated as transitory in these projections, which is consistent with Warsh's stated view that rate hikes do not address supply-driven inflation.
The Hidden Inflation Channel: Tanker Rates
The most important number the equity market is ignoring is $1.21 million.
That is the daily time charter equivalent rate for a VLCC on the TD3C route (Middle East Gulf to China) as of September 17. The breakeven for operating a VLCC is roughly $25,000-35,000 per day. The current rate is 35-50 times the breakeven.
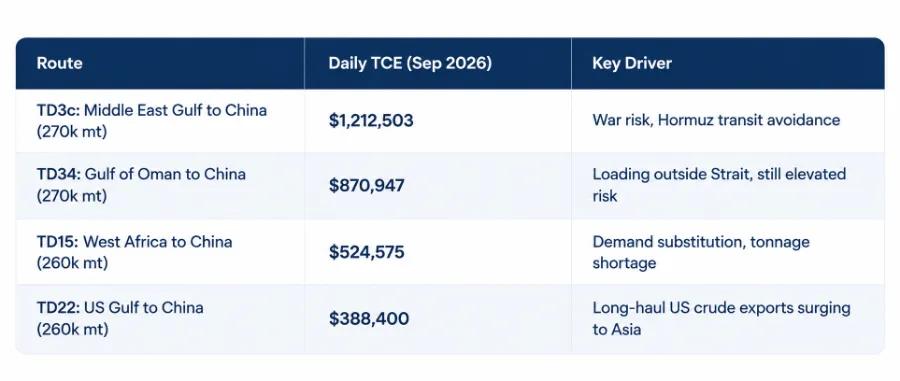
These rates are not visible in CPI today. They will be in 1-3 months. Here is the transmission chain:
Tanker rates surge. Shipping cost per barrel of delivered crude rises. Refinery input costs rise (even if wellhead prices are unchanged). Wholesale diesel and gasoline prices rise (the 24.1% PPI diesel surge in August is partly this). Transportation costs for every good that moves by truck, rail, or ship rise. Producers pass costs through to consumers. CPI accelerates with a lag.
The structural driver is the 30-day detour around the Cape of Good Hope. Ships that normally transit Hormuz in 2-3 days must instead route around Africa, adding roughly 30 days to each voyage. This reduces effective global fleet capacity by 15-20% without a single ship being destroyed. You need 15-20% more ships to carry the same volume of oil. Those ships do not exist. The orderbook for new VLCCs takes 2-3 years to deliver. Tanker rates stay elevated until either the Strait reopens fully or enough new tonnage is built. Neither happens quickly.
For equity investors, this is a margin compression signal hiding in plain sight. Every company that imports raw materials, exports finished goods, or relies on diesel for logistics is about to see input costs rise in ways that are not captured by watching the WTI spot price alone. The oil price at $103 is the headline. The tanker rate at $1.21 million per day is the story underneath.
Sector Map: Where the Puck Is Going
Now that the macro overhang has been absorbed, the market will differentiate at the sector level. Here is how the landscape looks post-hike:
Technology (selective). Mega-cap tech with AI monetisation continues to hold up. NVIDIA ($96.2B revenue), Broadcom ($29.6B, $34.8B guide), and CrowdStrike (cybersecurity as AI tailwind) are the names where earnings growth exceeds the higher cost of capital by a wide margin. The semiconductor supply chain is more vulnerable to multiple compression given the cyclical nature of equipment spending, but the demand data (TSMC utilisation at maximum, CoWoS lead times exceeding 50 weeks) does not support a demand peak thesis.
Energy. The obvious beneficiary. Every upstream producer with exposure to crude above $100 is printing record free cash flow. The tanker rate explosion benefits shipping companies (Frontline, Euronav, International Seaways). Refiners benefit from elevated crack spreads. The sector remains the hedge against the very inflation that is pressuring everything else.
Financials. Split outcome. Money center banks (JPM, GS, MS) benefit from trading revenue in a volatile environment and can offset NIM compression through diversification. Regional banks are the casualty of the bull flattener. Avoid until the curve steepens again.
Industrials. Indiscriminate selling has created stock-level opportunities within a sector-level headwind. Precision manufacturers with captive customers and pricing power (Howmet Aerospace, Moog) are being priced as if they were commodity producers with no moat. Defence names with multi-year backlogs funded by government budgets are being sold alongside construction companies with discretionary revenue. The sector needs stock picking, not sector allocation.
Consumer Discretionary and Staples. Higher input costs from tanker rates and diesel flow through to every consumer-facing business. Companies with pricing power (Procter & Gamble, Coca-Cola) can pass costs through. Companies without pricing power absorb the margin hit. The distinction between the two categories widens in this environment.
Utilities. Higher rates increase the cost of capital for utilities, which are the most debt-intensive sector by EBITDA. The bull case for utilities (data center power demand) is real but is being offset by the higher financing costs of building the capacity to meet that demand.
The Bottom Line
The macro events are done. The Fed has hiked. The auctions have cleared. The oil shock is priced. What remains is the earnings cycle and the stock-level differentiation that follows every major macro repricing.
The underlying economic data is constructive. PMI is expansionary. Retail sales are improving. The labour market is recovering. The AI infrastructure buildout continues to produce record revenue across the supply chain. These fundamentals have not changed because the Fed raised rates by 25 basis points.
What has changed is the cost of expressing every thesis. The risk-free rate is higher. The discount rate in every model is higher. The bar for earnings growth to justify current multiples is higher. The companies that clear that bar will be rewarded. The companies that don't will be repriced.
This is the environment where stock selection matters more than sector allocation, where balance sheet quality separates survivors from casualties, and where the dispersion between winners and losers widens with every basis point of yield increase. Position accordingly.
Appendix
Tanker Rates:
Middle East Conflict (from earlier sessions):
Baltic Exchange data (subscription required, referenced by all maritime sources above): https://www.balticexchange.com
BitDelta Securities Financial Services LLC, regulated by the Capital Market Authority under Category 5 (Introduction Only), acts solely as an introducer and does not provide trading, execution, dealing, advisory, portfolio management, or custody services. All trading, execution, and investment-related services are provided by BitDelta Limited, Mauritius, a licensed Investment Dealer excluding underwriting. All trading and investments involve risk. The value of investments may fluctuate, and you may receive less than your initial investment.
The information contained in this article is provided for general informational purposes only and does not constitute financial, investment, legal, or professional advice, or a recommendation to buy, sell, or hold any financial product. Readers should seek independent professional advice and conduct their own due diligence before making any decisions. Neither the publisher nor the contributors accept liability for any loss arising from reliance on this content.
Institutional multi-asset market access across MT5 Ultency, CQG, Iress Pro and BitDelta Terminal, with transparent execution standards and global market coverage.

Select the categories and companies you wish to follow directly to your person rss feed.
Create Custom RSS Feedjust now

just now
Sign up and join over 5,000 professional members who receive personalized news alerts, curated professional connections, and more for free!
WTI crude oil price forecast: A confirmed breakout above $94.765 could open the way toward $100.305, while weekly support remains at $87.360–$90.830.
NAS100 price forecast recap: Explore the Nasdaq 100 rally to 31,401.3, with technical analysis of the breakout and key support and resistance levels.
Learn how to identify, draw and trade XAUUSD supply and demand zones using Gold market structure, price action confirmation and clear risk management.
cTrader has been named Best Trading Platform at UF Awards APAC 2026 during iFX EXPO Asia in Hong Kong.
AUD/CHF reached last week’s 0.57732 bearish target. Learn how resistance, market structure and a neckline retest shaped the original price action forecast.
Businesses eventually reach a point where basic tools are not enough basic tools.
Multi-asset trading broker AvaTrade has agreed to acquire the majority of FXCM Group’s business and brand, in a transaction that would bring a longstanding retail FX franchise into the AvaTrade Group.
LSEG and CMC Markets have signed a multi-year strategic data agreement expanding CMC's access to LSEG's real-time and delayed pricing, reference and corporate actions data, news and analytics, plus AI-ready content, to support new products, entry into new markets and the growth of CMC's institutional and B2B partnerships.
The Tel Aviv Stock Exchange is considering a bid for the Cyprus Stock Exchange, with Israeli media citing its EU licence, trading platform and clearing house. Euronext’s Athens exchange and India’s National Stock Exchange are also seen as contenders, and Cyprus aims to sign a sale agreement by the end of this year.
CME Group will launch baseball futures on 12 October, pending regulatory review, tracking CME FutureSports Performance Indexes built on Official League Data. Standard and micro contracts will start with the 2026 Postseason and the four clubs in the League Championship Series, trading around the clock.