just now

Liquidity Finder Ltd is incorporated in England and Wales, company number 10610740, registered address 167-169 Great Portland Street, Fifth Floor, London W1W 5PF, United Kingdom.
Published: just now

Nvidia reports after today’s market close, but the real reaction only appears when trading opens tomorrow. The chart is already at a pressure point. Price is sitting on the anchored volume POC from the entire AI rally, momentum is washed out, and the broader market is in a defensive mood. This is the kind of setup where a single earnings print can flip the tone of the whole market.
Let’s walk through what this means before the numbers drop.
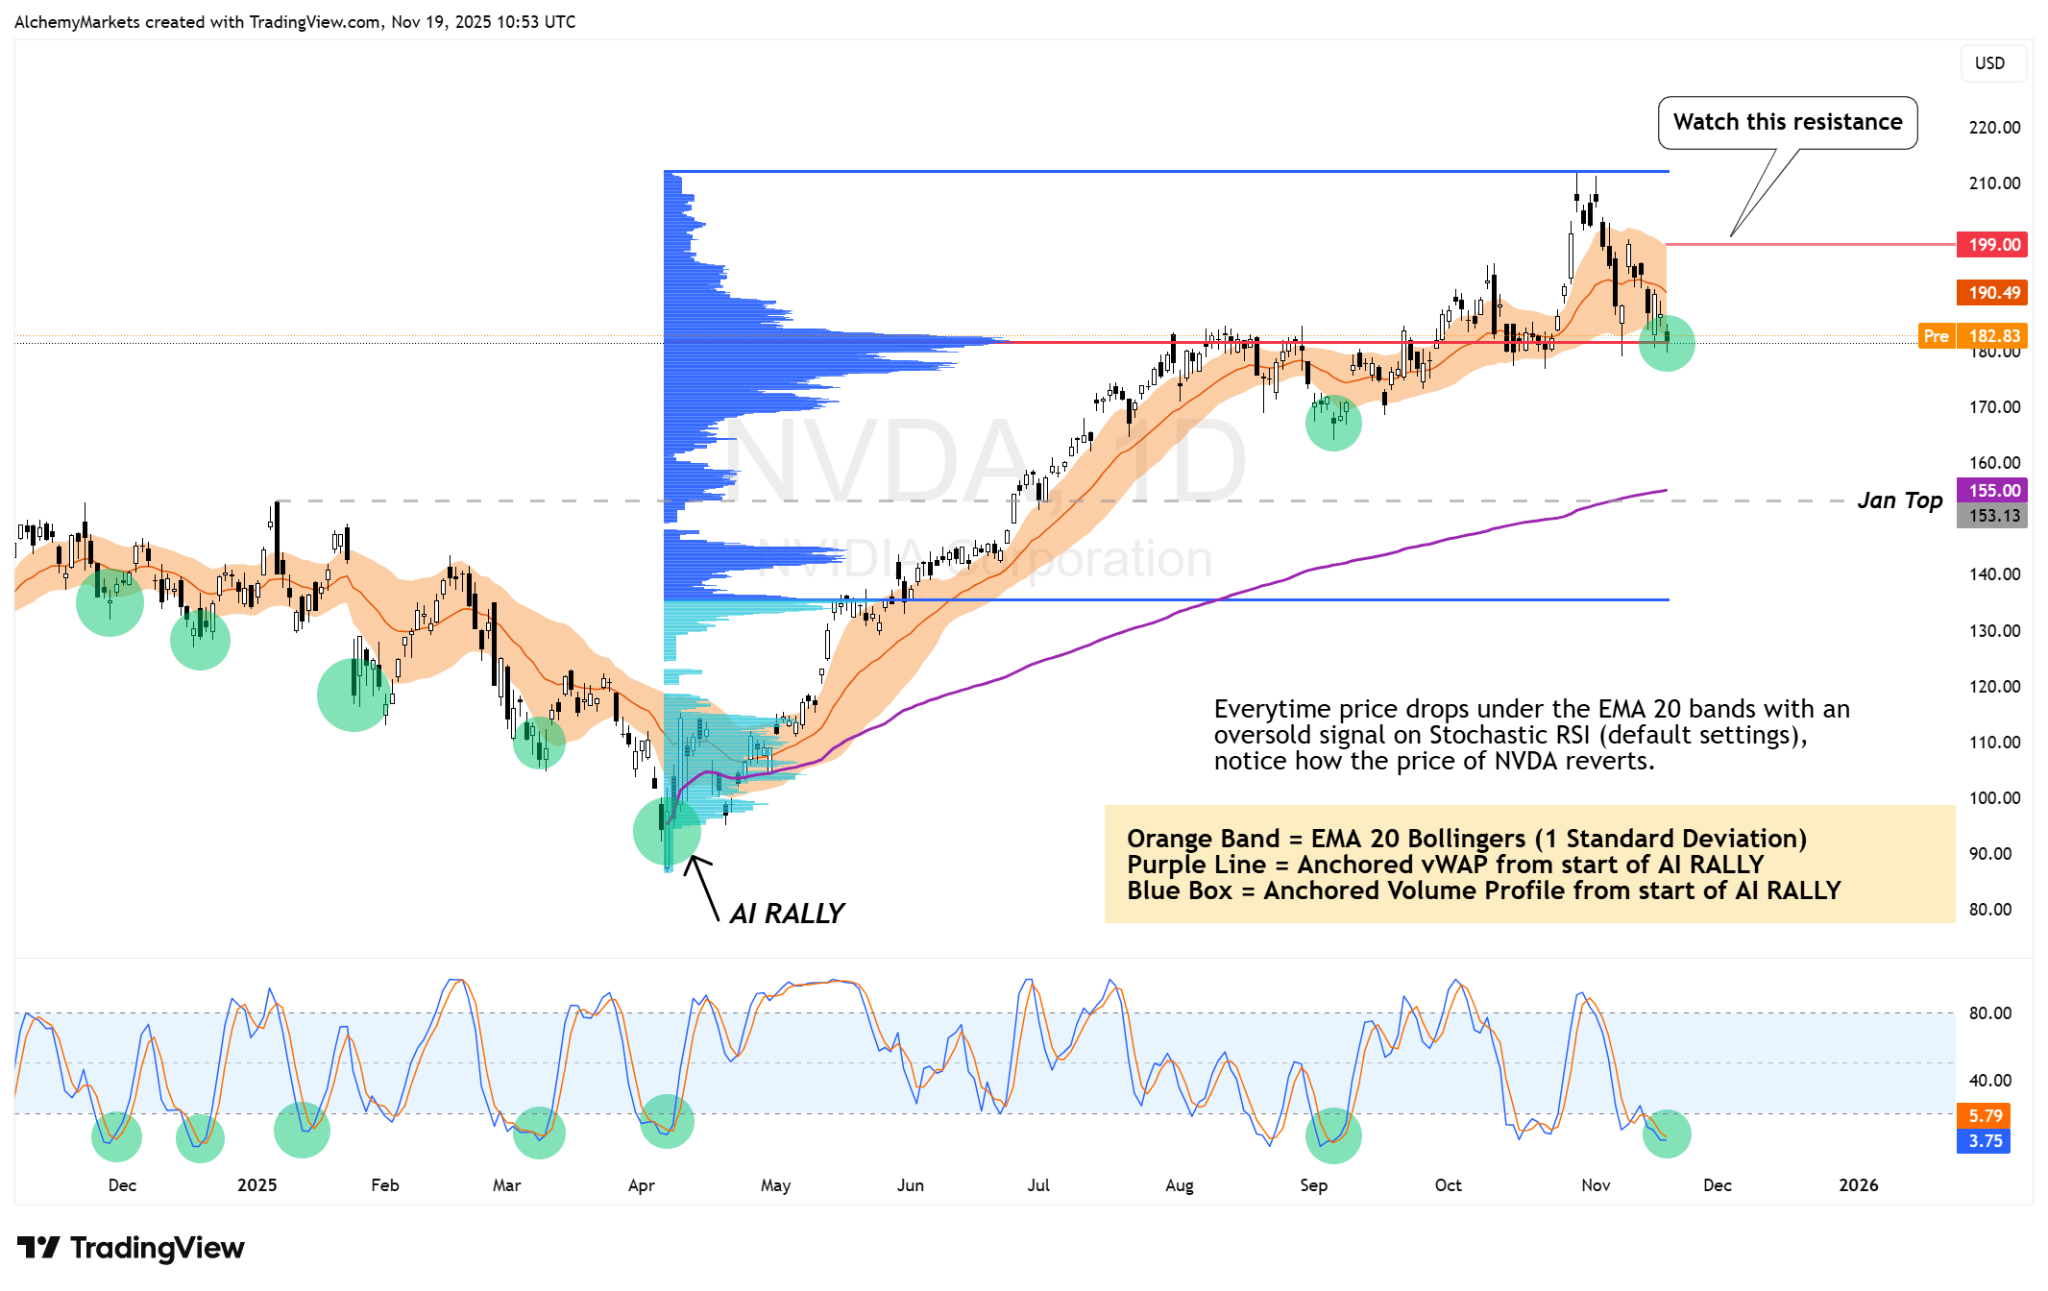
NVDA is sitting right on the Volume Profile Point of Control from the AI rally. That’s the price where the most volume has traded, which makes it a natural magnet for both support and indecision.
Price is also below the EMA 20 Bollinger bands (1 standard deviation) while the Stochastic RSI is oversold. Over the past year this exact combination has triggered clean reversion bounces every time. Each time price dipped under the band with washed out momentum, buyers stepped in and pushed it back toward the upper bands.
But history isn’t a guarantee. December 2024 is your caution flag. The same oversold setup appeared and NVDA bounced, yet the bounce was simply a retracement within a downtrend. You could see the same today. A reversion into resistance (upper band) that fails to break and hold higher can be the start of a larger downtrend.
In short, the chart supports a bounce, but it doesn’t remove the risk of a bearish trend shift.
Summary: NVDA has a valid bounce setup, but watch the upper band as resistance. Macro breakdown targets are the anchored vWAP of the rally, or lower at the January top at roughly $153.13.
It’s not just NVDA under pressure. Tech in general has pulled back with AI favourites losing steam due to increased CapEx, and comparatively low returns. The current read we’re getting is that global markets have shifted into a risk-off posture.
When traders derisk into a major earnings event, it raises the bar for any bullish reaction. A strong report is still able to spark a reversal, but it needs to be better than “good”. It needs to be confident, clear and forward leaning.
On the other hand, if the numbers come in soft or guidance sounds cautious, the market is already positioned in a way that can accelerate selling. This includes NVDA, the Nasdaq and anything tied to the AI theme.
Options are pricing a significant reaction with traders expecting a swing of around 7% to 8% once the dust settles. That’s a massive amount of potential movement for a company of this size. A gap is very likely tomorrow, but the direction depends on tonight’s report.
What will drive the move:
The numbers don’t need to be bad for the stock to fall. They only need to be less impressive than what the market has priced in. That’s the risk when expectations are sky high.
Here’s a cleaner way to frame the likely scenarios:
The key is that the first move is driven by earnings, but the second move is driven by positioning. The entire AI complex is watching this print. If NVDA delivers, tomorrow’s open can shock traders who derisked too aggressively. If it falls short, tomorrow becomes the start of a deeper unwind.
The Bottom Line
NVDA is sitting at a pivotal level with oversold momentum and the biggest catalyst of the month hitting after today’s close. The chart leans toward a bounce, but the trend risk is very real. The market’s reaction tomorrow morning will tell you which path this wants to take.
For now, treat the POC as the line in the sand. A hold keeps structure intact. A clean break turns this into a trend change.
DISCLAIMER: For educational purposes only. Trading comes with substantial risk, leading to possible loss of your capital. Traders are advised to do their own due diligence before investing.
You may also be interested in:
Why Bitcoin Is Dropping – And What Must Change Before It Can Recover
Alchemy Markets is a multi-asset brokerage providing retail traders with the same elite trading conditions, tools, and transparency typically reserved for institutions.
Select the categories and companies you wish to follow directly to your person rss feed.
Create Custom RSS FeedSign up and join over 5,000 professional members who receive personalized news alerts, curated professional connections, and more for free!
Sydney-based multi-asset broker ACY Securities has introduced PAXGUSD, a new CFD instrument that allows clients to trade tokenised gold against the US Dollar 24 hours a day, seven days a week. The instrument is available across MetaTrader 4, MetaTrader 5, and the ACY Trading Platform.
Binance has lowered its VIP 3 Wallet Assets threshold from $3 million to $1 million and will now count OTC Spot Trading Volume at a 4x multiplier toward VIP qualification, removing the previous VIP 4 cap and allowing eligible users to progress through the full tier framework up to VIP 9.
Retail futures trading leader NinjaTrader Group has appointed Mark Omens as Senior Vice President, Commercial Strategy, bringing a 25-year veteran of derivatives marketplace CME Group into a newly created role focused on exchange partnerships and enterprise growth.
Gold Price Action Forecast: Will XAU/USD Drop to $3930? Meta Description: Read our Gold price action forecast to see if XAU/USD will drop to $3930.
BitDelta Securities Financial Services LLC (“BitDelta Securities”) today announced that it has received full regulatory approval from the Capital Market Authority (“CMA”) of the United Arab Emirates under the Category 5 — Arrangement and Advice license framework (License No. 20200000439). The approval follows the firm's receipt of In-Principal Approval earlier this year and represents the successful conclusion of the CMA's full licensing process, including the satisfaction of capital requirements, governance appointments, and operational setup.
Crypto.com has received a $400 million strategic investment from Citadel Securities, valuing the firm at $20 billion. It marks the first institutional funding round in the company's history, aimed at accelerating its expansion into tokenised securities, derivatives and other asset classes.
WTI’s pullback into $79–82 is the first major test of the bullish Elliott Wave count, with buyers targeting a renewed break above $85.

BitDelta Securities has secured a full CMA Category 5 licence in the UAE and opened a regulated office in Business Bay, Dubai. The firm operates as an introducing broker, connecting investors with licensed international brokers across multiple asset classes, with CEO Dr. Demetrios Zamboglou commenting on the milestone.
Index volatility is asleep while single stocks fight it out underneath, credit refuses to confirm the equity rally, and a bare macro calendar hands next week to oil.
Digital assets and FX brokerage GC Exchange FZE (GCEX) has appointed Mohammed A. Mulla as a Board Member of its Dubai-based entity, part of the wider GCEX Group.