just now

Liquidity Finder Ltd is incorporated in England and Wales, company number 10610740, registered address 167-169 Great Portland Street, Fifth Floor, London W1W 5PF, United Kingdom.
Published: just now

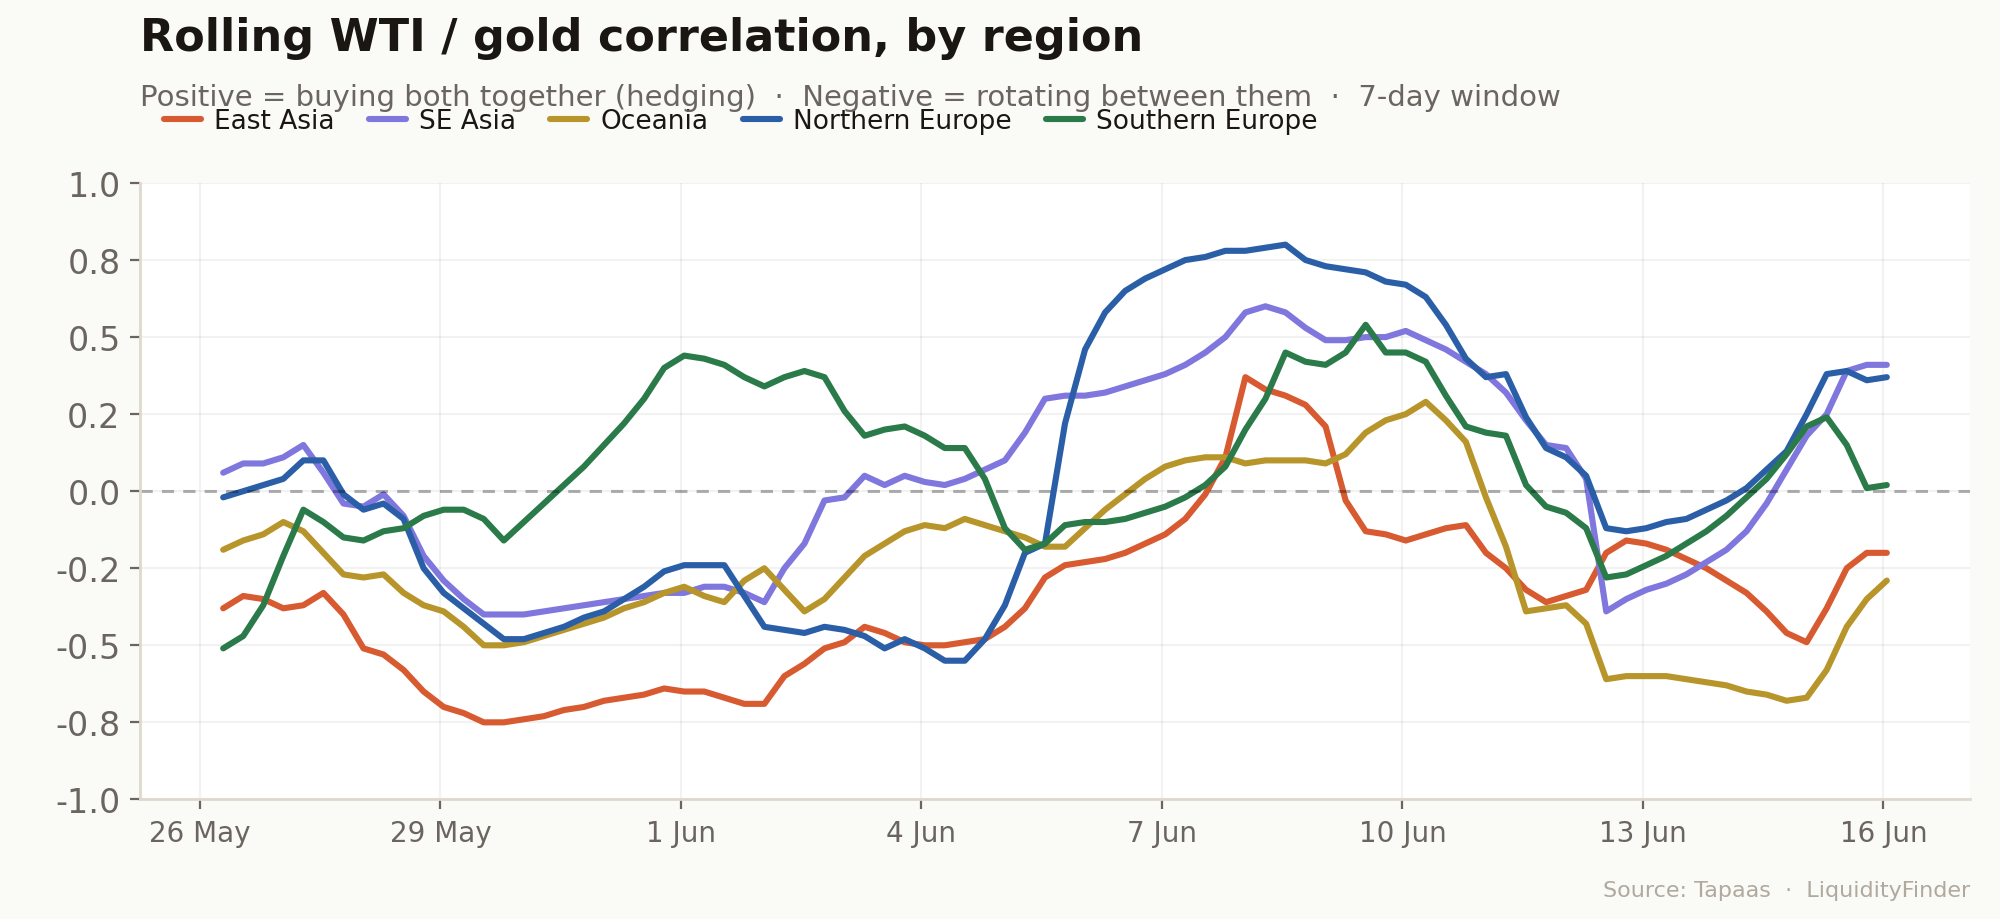
New data from trade-flow analytics firm Tapaas (@Tapaas ) tracks how traders across ten markets, grouped into five regions, were buying and selling two of the world's most closely watched assets, WTI crude oil and gold, over the four weeks to 16 June.
The data shows what happened during the war between the United States and Iran, which began in February and pushed oil prices up with the closure of the Strait of Hormuz. For weeks, a US naval blockade and the threat of closure kept a fear premium in the oil price and helped support gold as a safe place to hold money.
On 14 June, Donald Trump and Iran announced a 'deal' to end the fighting and reopen the strait, with Trump saying "let the oil flow" and ordering the blockade removed. If the deal holds, the supply fear that drove much of this trading could fade quickly, and the strong bullish view on oil that Europe in particular had built up may start to unwind. But this is only a first-stage agreement. Several important issues are still open, and continued Israeli strikes in Lebanon have already put it under pressure. In short, the regional split shown here is a snapshot of how the world traded the war, taken just as the war may be ending.
What it reveals is a striking lack of agreement. Faced with the same run of news, the regions moved in different and often opposite directions: some treated oil and gold as safe havens to buy together, others picked one over the other, and a few that had been trading as a bloc broke apart and stopped agreeing among themselves. Rather than one global trade, the data shows five regional ones, which makes where a trade is coming from as telling right now as what is being traded.
The dataset looks at retail CFD positioning covering ten markets in five regions. It measures how many traders were betting that prices would rise, counted both by number of trades and by volume.
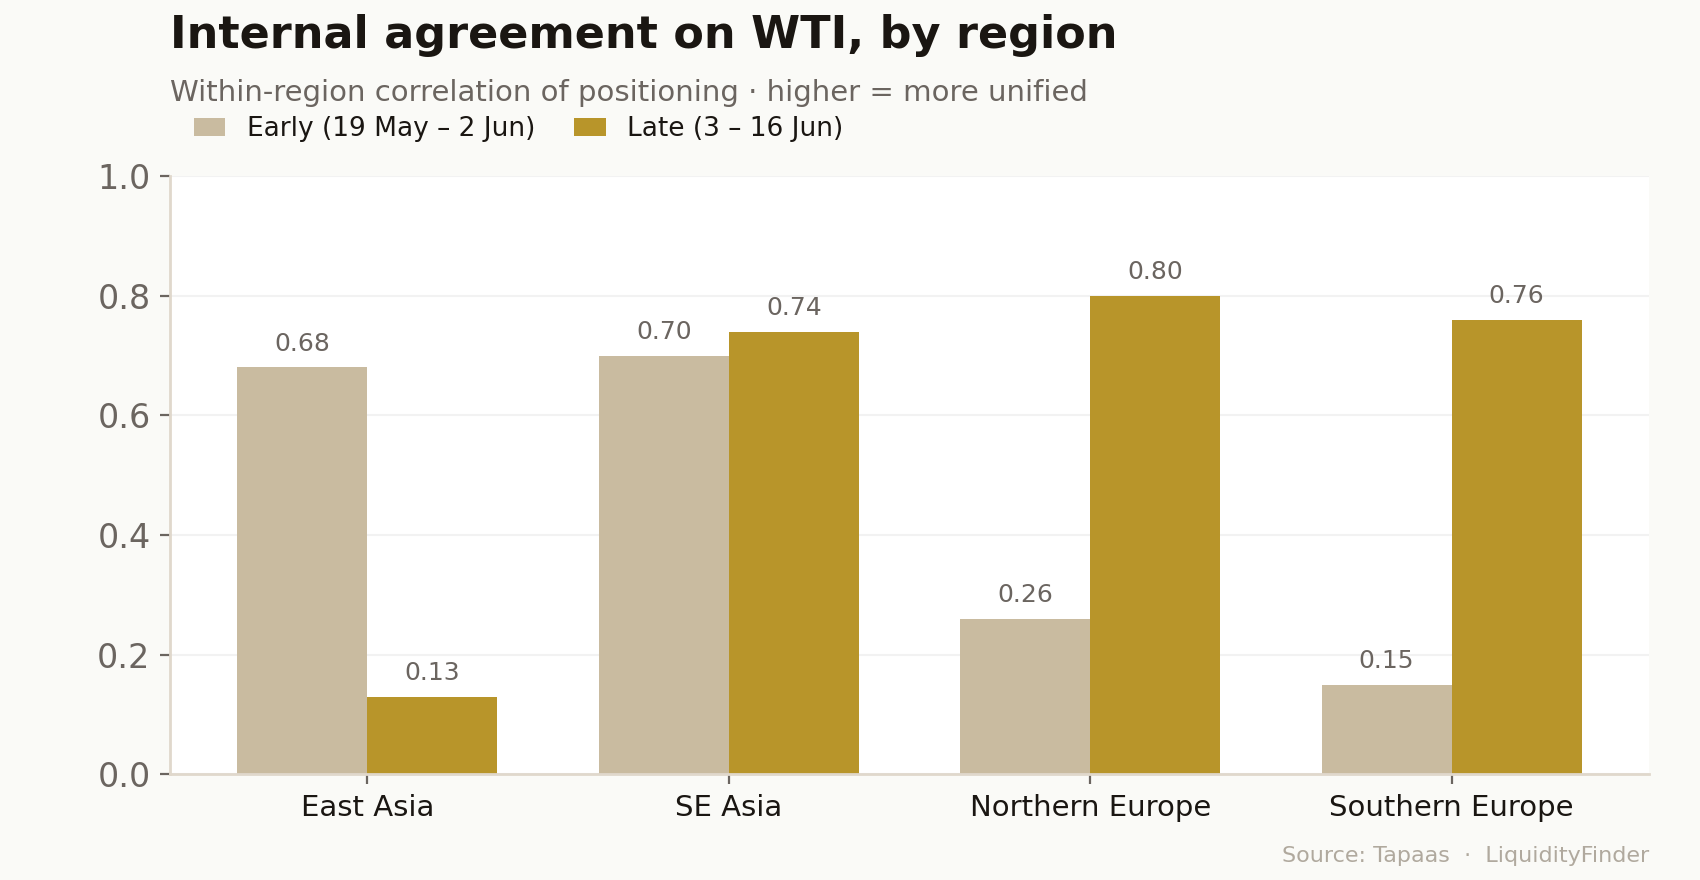
At the start of the past month, China and Hong Kong traded oil in a very similar way. Their agreement was strong, with a score of 0.68, where 1.0 means full agreement and 0 means none. By June that agreement had almost gone, down to 0.13. The same thing happened with gold, where their score fell from 0.51 to 0.14. Hong Kong sold its oil positions while China kept them. The two stopped trading as one.
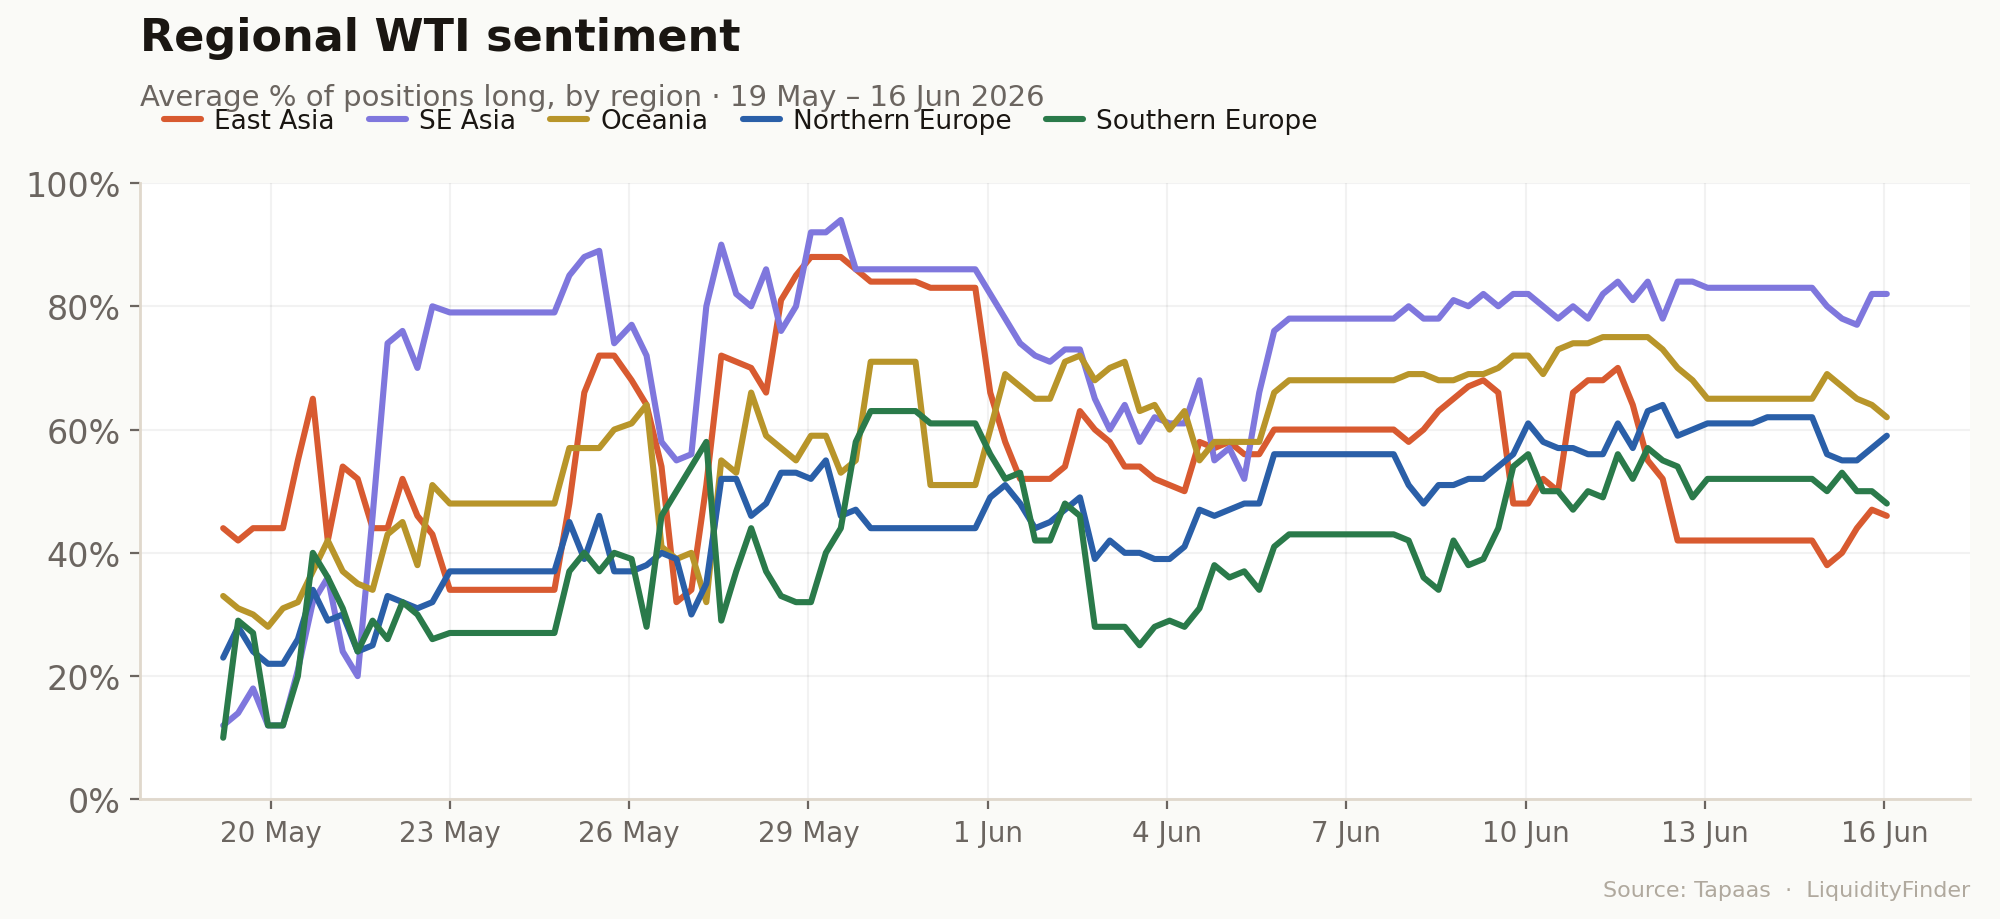
Northern and Southern Europe started far apart on oil, with scores of 0.26 and 0.15. By mid-June they were close together, at 0.80 and 0.76. Spain, Germany, Poland, Italy and the United Kingdom ended up with the same view: they expected the oil price to rise. So while Asia split apart, Europe came together.
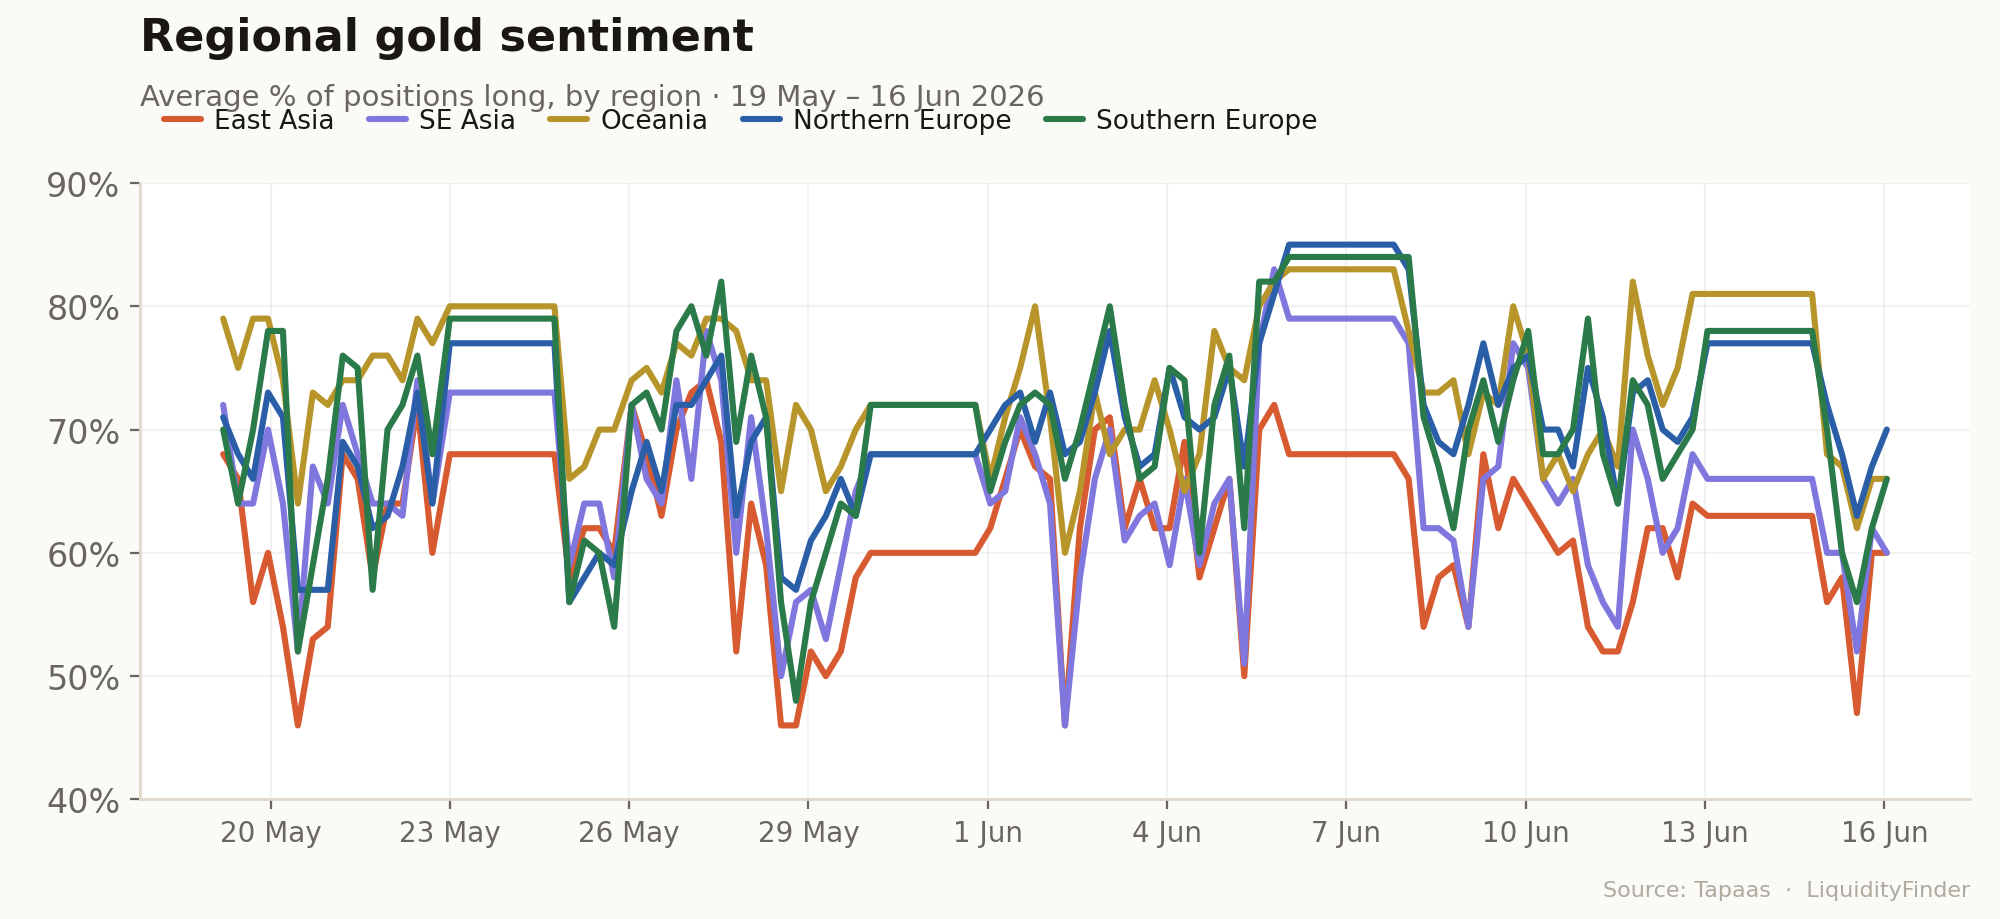
Gold moved less than oil, but the data still tells us something. Northern Europe agreed on gold throughout the period, and agreed even more strongly by the end, with its score rising from 0.79 to 0.87. At the same time, Germany, Poland and the UK steadily bought more gold, which suggests they treat it as a safe place to hold money when there is risk.
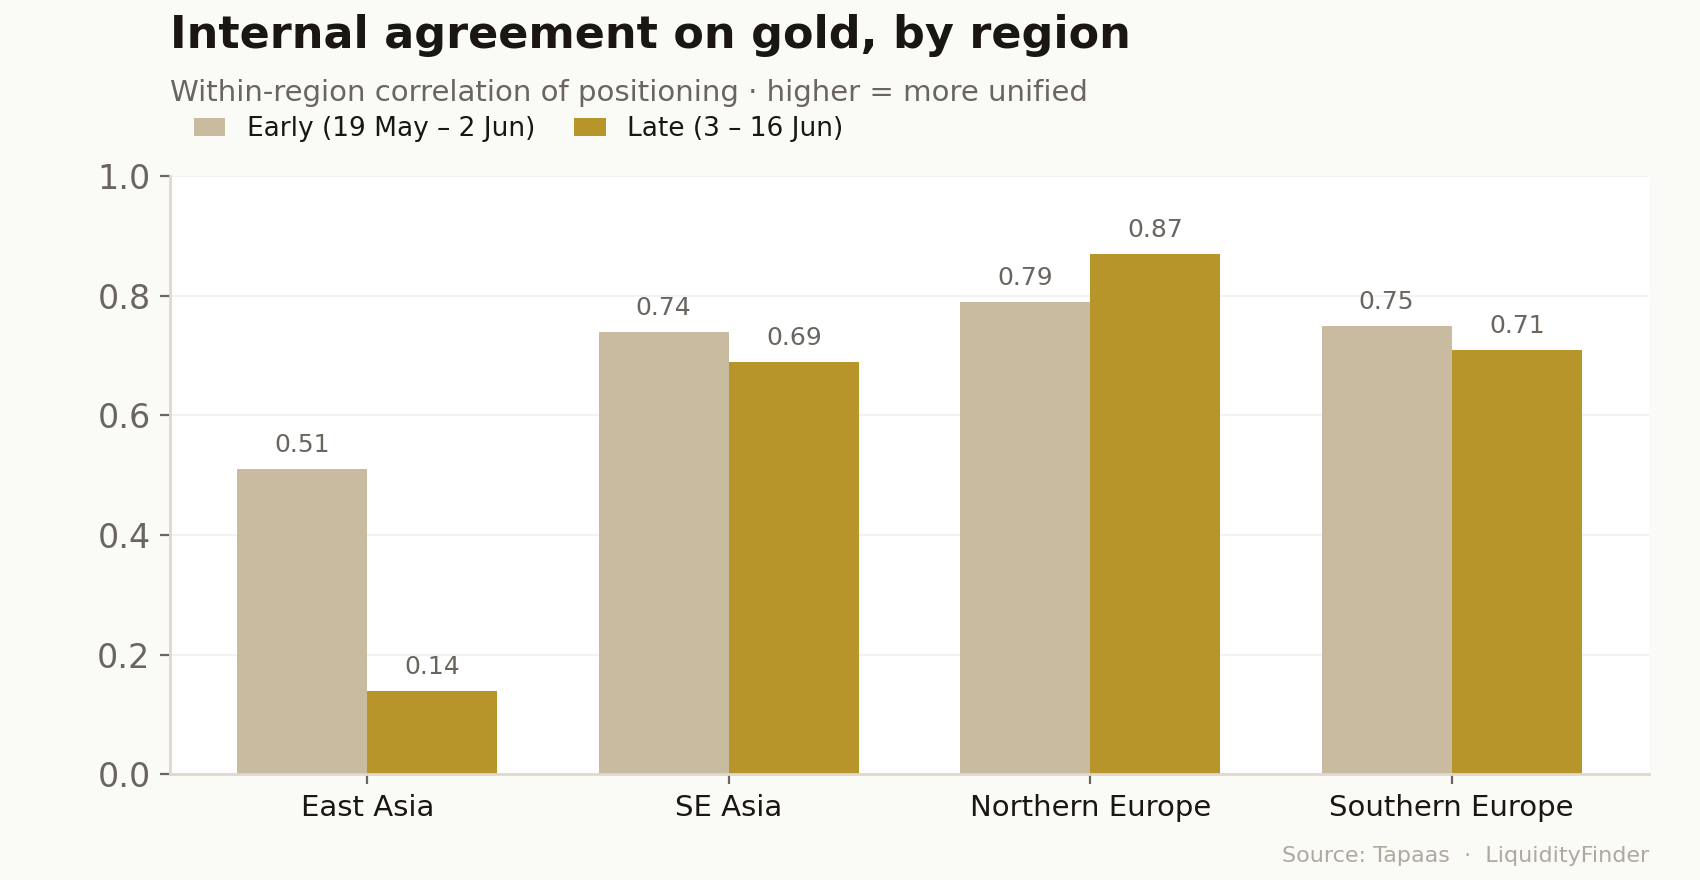
The two Asian regions did not follow. South East Asia and East Asia held roughly flat on gold while Europe bought more, so by mid-June they were the least keen on it. South East Asia is still worth noting for one reason: Singapore and Thailand kept trading gold in step with each other the whole way through, even as they fell behind the rest of the world.
A useful question is whether each region treated oil and gold as the same trade, or as opposites. If a region buys both at the same time, it is protecting itself against risk. If it buys one and sells the other, it is choosing between them.
Northern Europe is the clearest case. Early on, its oil trades and gold trades had little to do with each other. From around 5 June, they moved together strongly, with a score of up to 0.84. Germany, Poland and the UK bought oil and gold at the same time. This is a sign that they expected higher prices and more risk, so they protected themselves on both sides.
Australia did the opposite. In June, it began to buy one and sell the other. East Asia did much the same throughout the period, treating oil and gold as a short-term trade rather than as protection. South East Asia slowly began to buy both together from early June. This suggests that Singapore and Thailand expected the supply problem to last.
For LiquidityFinder readers managing risk, the theme is regional dispersion. A single macro shock that might be expected to push global positioning the same way has instead had a different effect on different region, and the split is not random. Europe is hedging, Oceania is rotating, East Asia is trading, and South East Asia is quietly accumulating. For anyone pricing flow, managing risk across regional books, or building a view of where the next wave of demand sits, it might be best to look at these asset classes regionally rather than globally.
Found this interesting? Become a member of LiquidityFinder, join the community and join the discussion - join here.
We're the largest marketplace to connect with brokers, Fintech companies & digital asset firms. Want to partner? Let's get in touch.
Select the categories and companies you wish to follow directly to your person rss feed.
Create Custom RSS FeedSign up and join over 5,000 professional members who receive personalized news alerts, curated professional connections, and more for free!
: How the Federal Open Market Committee decisions change the cost of borrowing money? Learn how U.S. interest rates shift stocks, bonds, and the U.S. dollar today.
Want to join the ranks of profitable traders? Discover why mastering your trading psychology and sticking to a trading plan is the real key to success.
The EUR/USD pair deals with bearish weight as a hawkish Federal Reserve and increasing geopolitical tensions testing the critical support 1.1400 region.
Read my EUR/USD price action forecast for this week. Will the 1.14150–1.14520 EUR/USD resistance level trigger a massive drop? Find out here.
Pepperstone has expanded its Perpetual CFD suite beyond digital assets, adding Gold, Silver, Nasdaq, S&P 500, WTI and Brent Crude to its lineup. The regulated broker aims to bring perpetual market mechanics, first popularised in crypto, into traditional asset classes as global markets shift toward continuous, round-the-clock trading access.
cBridge, Spotware's fixed-price liquidity bridge, has partnered with institutional CFD liquidity provider STARPRIME, giving brokers access to multi-asset liquidity across FX, metals, indices, commodities and crypto, alongside aggregation, routing, exposure monitoring and reporting tools.
USD/CAD cools inside a tight bull flag as CPI, the BoC and a little-known tariff deadline all land in the same week.
Former TradingView CEO Oleg Mukhanov joins GoCharting as President and COO, with ex-TradeStation chief Salomon Sredni as Chairman, alongside Long Ridge investment.
Databento, the market data platform for modern finance, has raised a $97 million Series B led by NEA, with participation from DRW Venture Capital, Redpoint Ventures and Tribe Capital. The oversubscribed round drew over $300 million in demand and will fund global infrastructure and data centre expansion.
CME Group has announced Treasury Link, an industry-first functionality connecting CBOT Treasury futures and BrokerTec cash Treasuries via CME Globex. Leveraging FX Link technology, the service enables single-submission spread trading, eliminating legging risk, and is expected to launch in Q4 2026, pending regulatory review.