just now


Liquidity Finder Ltd is incorporated in England and Wales, company number 10610740, registered address 167-169 Great Portland Street, Fifth Floor, London W1W 5PF, United Kingdom.
Published: just now
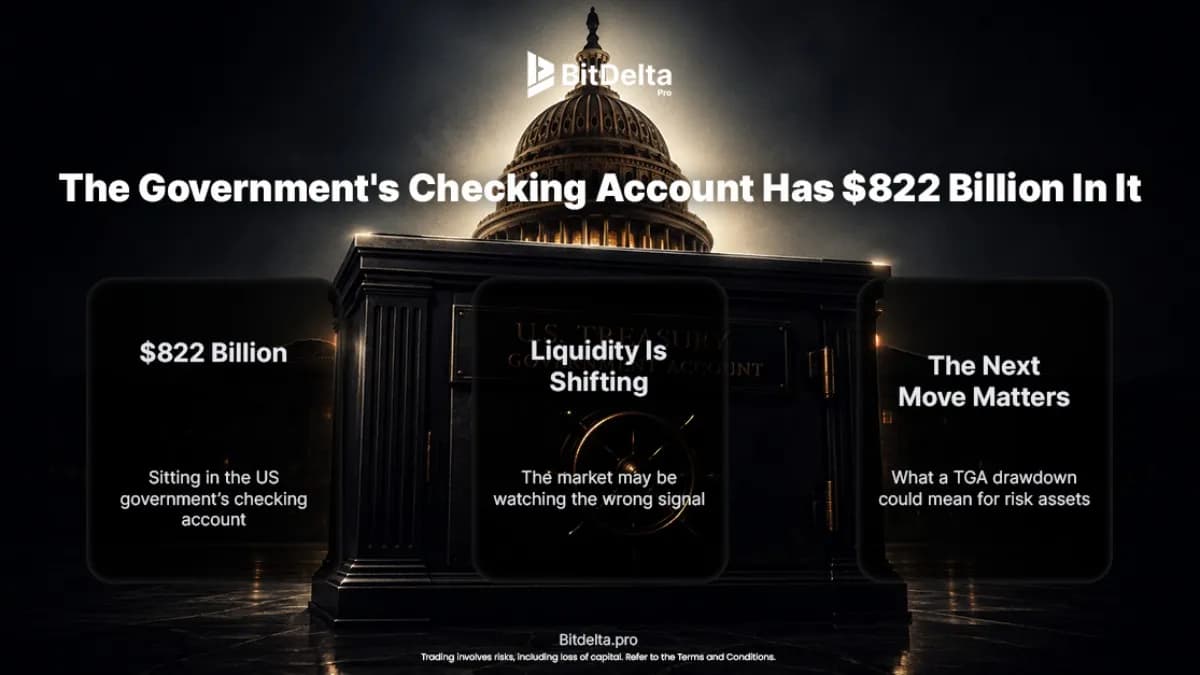
There is $822 billion sitting in a single bank account at the Federal Reserve Bank of New York. It belongs to the US Treasury. It is the largest pool of undeployed fiscal firepower in the developed world. And most equity investors pay little attention to it.
The Treasury General Account is the US government's checking account. Every dollar of tax revenue, every dollar raised at a Treasury auction, flows into this account. Every dollar the government spends, from Social Security checks to defense contracts to infrastructure payments, flows out of it. The balance at any given time tells you how much cash the government has on hand and has not yet spent.
At $822 billion, the current balance is approaching levels last seen during the pandemic, when the TGA peaked at approximately $1.8 trillion before the government deployed it as stimulus into the economy. Understanding what this number means, how it got there, and what happens when it moves is essential for anyone trying to understand liquidity conditions in the second half of 2026.
How the TGA Works
The mechanics are simple, but their market implications are significant.
The TGA sits on the liability side of the Federal Reserve's balance sheet. On the other side of that same balance sheet sit bank reserves: the deposits that commercial banks hold at the Fed. These two accounts are connected by a zero-sum relationship. When money flows into the TGA (through tax collection or Treasury auctions), it flows out of bank reserves by the same amount. When money flows out of the TGA (through government spending), it flows back into bank reserves.
This means every dollar the Treasury collects and holds in the TGA is a dollar removed from the banking system. Not destroyed. Not lost. Just parked in an account that the private economy cannot access until the government decides to spend it.
To illustrate: when a bank buys $1 billion of Treasury bills at auction, its reserve balance at the Fed decreases by $1 billion and the TGA increases by $1 billion. The Fed's total balance sheet has not changed. But the composition of its liabilities has shifted from reserves (which banks can lend, invest, and use for economic activity) to TGA (which sits inert). The money has moved from the economy's bloodstream into the government's vault.
This is why a rising TGA tightens financial conditions even when the Fed has not changed interest rates. It is also why a falling TGA (government spending down the balance) loosens financial conditions without any Fed action. The TGA is a fiscal liquidity lever that operates entirely outside of monetary policy.
Why Low Rates Do Not Mean Abundant Liquidity
This is the concept that most equity investors misunderstand, and it matters enormously right now.
The conventional assumption is that interest rates tell you about liquidity. Low rates mean easy money. High rates mean tight money. This is incomplete to the point of being misleading.
Liquidity in the financial system is not determined by the interest rate alone. It is determined by the amount of usable reserves in the banking system. And those reserves are a function of three variables, not one:
Net Liquidity = Fed Balance Sheet minus TGA minus ON RRP
The Fed's balance sheet (WALCL) represents the total assets the Fed holds, primarily Treasuries and mortgage-backed securities. These assets were purchased by creating bank reserves, so a larger balance sheet generally means more reserves in the system.
The TGA drains reserves, as described above. Every dollar in the TGA is a dollar not circulating in banks.
The Overnight Reverse Repo Facility (ON RRP) is the third drain. This is a facility where money market funds and other institutions park cash overnight at the Fed, earning the ON RRP rate. Money in this facility is also removed from the active banking system.
The actual liquidity available to the financial system is what remains after subtracting both drains from the Fed's total assets. A $7 trillion Fed balance sheet with a $1 trillion TGA and a $500 billion ON RRP has the same net liquidity as a $6 trillion balance sheet with a $300 billion TGA and a $200 billion ON RRP. The headline number is different. The plumbing delivers the same result.
Between September 2022 and March 2026, the Fed removed $2.14 trillion from its balance sheet through quantitative tightening. That should have been massively contractionary. But over the same period, $2.37 trillion drained out of the ON RRP facility and back into the banking system, more than fully offsetting the QT. Net liquidity actually increased while the Fed was tightening. This is why the stock market rallied through most of the tightening cycle and why analysts who predicted a crash based on QT alone were wrong. They were watching the wrong variable.
Now apply this to the current environment. The fed funds rate is 3.50-3.75%. That sounds moderately restrictive. But the TGA is at $822 billion and climbing. Each $100 billion increase in the TGA removes an equivalent amount from bank reserves without any Fed action. The rate can stay unchanged while the liquidity in the system quietly tightens through fiscal plumbing.
Conversely, when the government starts spending that $822 billion, reserves will flood back into the banking system. The rate will still be 3.50-3.75%. But the actual liquidity conditions will ease dramatically. This is why TGA drawdowns have historically coincided with equity rallies and risk-on moves, even when the Fed was holding rates steady or tightening. The fiscal injection overwhelms the monetary stance.
The Bills-Over-Bonds Strategy
The composition of the debt being issued to fill the TGA matters as much as the total amount.
Under Treasury Secretary Bessent, the Treasury has shifted its issuance mix aggressively toward short-term bills and away from long-dated notes and bonds. This is a deliberate strategy, not a market response.
When Treasury issues a 30-year bond, it adds duration to the market. Investors who buy it have capital locked up for three decades. The bond competes with other long-duration assets for allocation. More supply of long bonds pushes long-end yields higher.
When Treasury issues a 4-week or 12-week bill, the dynamic is different. Bills are absorbed primarily by money market funds and bank treasury desks. They are functionally equivalent to cash with a small yield premium. They do not compete with equities or corporate bonds for allocation in the same way long-dated bonds do. And they mature quickly, meaning the duration impact on the market is minimal.
By shifting issuance toward bills, Treasury achieves several objectives simultaneously. It reduces the supply of long-dated bonds in the market, which puts downward pressure on long-end yields over time. It shortens the weighted average maturity of outstanding government debt, which reduces the government's sensitivity to interest rate changes on its existing obligations. And it provides the mechanism for the Fed to shift its own balance sheet composition: as long-dated securities in the Fed's SOMA portfolio mature and are not replaced, the overall stock of notes and bonds in the market shrinks while the stock of bills grows.
The risk, which should be acknowledged, is that shorter-duration debt needs to be rolled over more frequently. If short-term rates spike for any reason, Treasury is refinancing a larger share of its obligations at whatever the prevailing rate happens to be. Long-term bonds lock in a rate for decades. Bills lock in a rate for weeks. The strategy works in a stable or declining rate environment. It becomes a liability if rates rise sharply and stay elevated.
The $822 Billion Bazooka
The fiscal implications of the current TGA balance are significant and largely unpriced by the equity market.
$822 billion in the government's checking account represents a stimulus package waiting to be deployed. Not speculative. Not theoretical. The cash is already collected. It does not require new legislation to authorize spending. It requires Congressional appropriation to direct it.
The Republican majority is widely expected to deploy a substantial fiscal package ahead of the midterm elections. The timing is politically logical: stimulus spending that reaches voters 3-6 months before an election has the highest political return on investment. The composition of that spending will determine its economic impact. Infrastructure disbursements and defense procurement flow through contractors and into wages over multi-year timelines. Direct payments and tax rebates flow into consumer spending within weeks.
When the TGA draws down, the mechanical effect is identical to quantitative easing. Bank reserves increase. Liquidity in the financial system expands. Risk assets benefit. The 2020-2021 precedent is instructive: the TGA peaked at approximately $1.8 trillion in mid-2020, then was spent down to approximately $100 billion by late 2021. That drawdown injected over $1.5 trillion of liquidity into the economy over 18 months, funding stimulus checks, PPP loans, enhanced unemployment benefits, and infrastructure spending. It was, in mechanical terms, the largest liquidity injection in history, and it occurred entirely through the fiscal channel while the Fed's balance sheet was a separate operation.
The current $822 billion balance is smaller but still substantial. A drawdown of even half that amount ($400 billion) would inject liquidity equivalent to a meaningful round of quantitative easing, without the Fed taking any action. In an economy already running hot on 17.2% equipment investment growth and 20.7% federal nondefense spending growth, the additional fiscal stimulus could further widen the K-shaped divergence between the investment economy and the consumer economy.
For the investment economy, the TGA drawdown is unambiguously bullish. More government spending means more defense contracts, more infrastructure procurement, more reshoring subsidies, more demand for the companies that sell to the government. Corporate earnings benefit directly.
For the consumer economy, the effect depends entirely on how the money is spent. If it flows through business channels (contracts, subsidies, tax credits), it benefits corporations first and reaches consumers as wages with a delay. If it flows as direct payments or tax rebates, consumers benefit immediately but the inflationary impact is also immediate.
For the Federal Reserve, the TGA drawdown is a complication. Warsh is trying to tighten financial conditions through balance sheet reduction. A large TGA drawdown would loosen conditions through the fiscal channel, partially or fully offsetting the monetary tightening. The Fed controls the interest rate and the balance sheet. It does not control the TGA. Fiscal and monetary policy may be working at cross-purposes in H2 2026.
What to Watch
TGA balance trajectory. The Daily Treasury Statement (published by the US Treasury's Bureau of the Fiscal Service) reports the TGA balance daily. Track it. A sustained drawdown signals that fiscal spending is hitting the economy, reserves are rising, and liquidity is easing regardless of what the Fed does.
Bills-versus-bonds issuance mix. The Quarterly Refunding Announcement (next one in early August) will detail Treasury's planned issuance composition. A continued tilt toward bills and away from notes/bonds confirms the Bessent strategy is intact and supports the view that long-end yields will decline structurally over time.
Net liquidity composite. Fed balance sheet minus TGA minus ON RRP. This single number tells you more about the direction of risk assets than the fed funds rate, CPI, or any individual economic indicator. When net liquidity rises, equities and crypto tend to follow. When it falls, they tend to follow. The correlation is not perfect, but it is the strongest single-variable predictor of broad market direction over the past decade.
Congressional spending legislation. Any movement on a pre-midterm fiscal package. The timing and composition of the spending will determine whether the TGA drawdown is inflationary (direct payments) or investment-driven (contracts, subsidies, reshoring incentives). The market impact differs materially between the two.
Investments may fluctuate in value and you may receive less than your original investment. Past performance is not indicative of future results. Please remove This content is for informational purposes only.
All data sourced from the Federal Reserve (H.4.1 release), US Treasury (Daily Treasury Statement), Federal Reserve Bank of St. Louis (FRED), and Eco3min Research. Past performance is not indicative of future results.
Institutional multi-asset market access across MT5 Ultency, CQG, Iress Pro and BitDelta Terminal, with transparent execution standards and global market coverage.

Select the categories and companies you wish to follow directly to your person rss feed.
Create Custom RSS FeedSign up and join over 5,000 professional members who receive personalized news alerts, curated professional connections, and more for free!
Multi-asset trading broker AvaTrade has agreed to acquire the majority of FXCM Group’s business and brand, in a transaction that would bring a longstanding retail FX franchise into the AvaTrade Group.
LSEG and CMC Markets have signed a multi-year strategic data agreement expanding CMC's access to LSEG's real-time and delayed pricing, reference and corporate actions data, news and analytics, plus AI-ready content, to support new products, entry into new markets and the growth of CMC's institutional and B2B partnerships.
The Tel Aviv Stock Exchange is considering a bid for the Cyprus Stock Exchange, with Israeli media citing its EU licence, trading platform and clearing house. Euronext’s Athens exchange and India’s National Stock Exchange are also seen as contenders, and Cyprus aims to sign a sale agreement by the end of this year.
CME Group will launch baseball futures on 12 October, pending regulatory review, tracking CME FutureSports Performance Indexes built on Official League Data. Standard and micro contracts will start with the 2026 Postseason and the four clubs in the League Championship Series, trading around the clock.
ESMA has published an opinion stating that MiCA-authorised crypto-asset service providers should cease services tied to non-MiCA-compliant stablecoins for EU clients across MiCA crypto-asset services. National authorities should require remediation of existing exposures within three months, by early January 2027.
Nasdaq Ventures has made a strategic investment in Amsterdam-based derivatives and crypto exchange One Trading, with both firms to explore 24/7 trading of equity futures. The undisclosed investment follows Nasdaq's US$100 million investment in Payward, the parent of Kraken, and CME Group's move to 24/7 trading.
cTrader has opened multi-platform plugins to brokers and prop firms, which can pre-install their own tools for clients or list them in cTrader Store. The plugins run across Mobile, Web, Windows and Mac, and can be built and launched independently of core-platform releases, including trading journals and calculators.
Institutional brokerage and financial infrastructure provider Clear Street has joined TradingView’s broker network, allowing its clients to trade US stocks, exchange-traded funds and options directly through the charting and analysis platform.
Learn how to improve trading psychology, manage fear and greed, avoid revenge trading, and follow your trading strategy with discipline and a trading journal.
GTC Prime has announced a strategic partnership with Centroid Solutions to manage and distribute its liquidity through CS 360 Bridge, Centroid's multi-asset connectivity and execution engine, giving brokers and institutional clients access to tailor-made pricing, low-latency execution and real-time risk management.