just now

Liquidity Finder Ltd is incorporated in England and Wales, company number 10610740, registered address 167-169 Great Portland Street, Fifth Floor, London W1W 5PF, United Kingdom.
Published: just now

Five major equity indices enter the third quarter reading five different structures. What ties them together is not a shared direction but a shared tension: earnings that keep beating, an AI capex cycle funding them, and a Fed leaning against the whole thing. Below, the chart leads and the macro confirms — because in every case, the structure was leaning before the headlines crossed.
The story of this market is that it keeps doing more than it is supposed to.
For seven straight quarters, S&P 500 earnings have beaten what analysts penciled in — not by rounding errors, but quarter after quarter, by real margins. Wall Street sets the bar; corporate America clears it. Q2 2026 is expected to land near 23% year-on-year earnings growth, a second straight quarter above 20%, and if the pattern holds, even that is probably light.
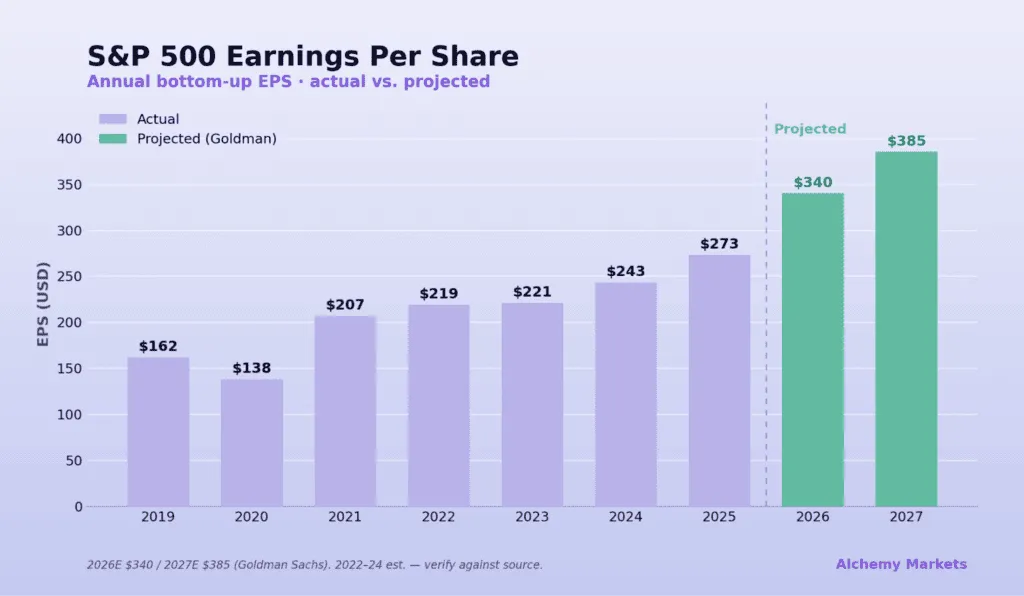
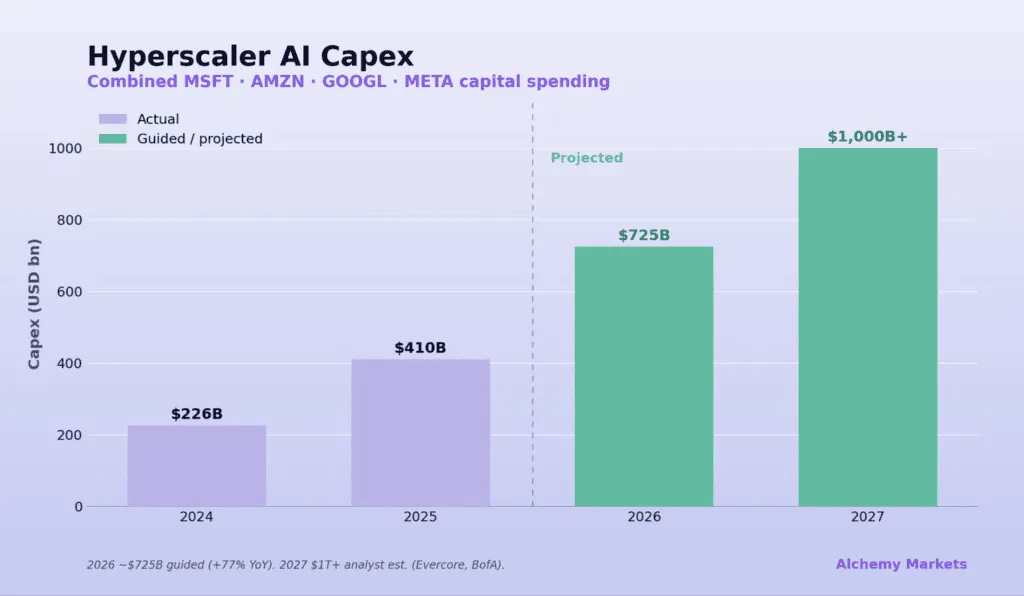
Underneath the beats sits one engine doing most of the work. The four largest hyperscalers — Microsoft, Amazon, Google and Meta — spent a combined $410 billion on capacity last year and have guided that toward $725 billion this year, on the way to a trillion-plus. That is the AI capital-expenditure cycle in a single line, and it is the structural reason earnings keep beating and indices keep grinding higher.
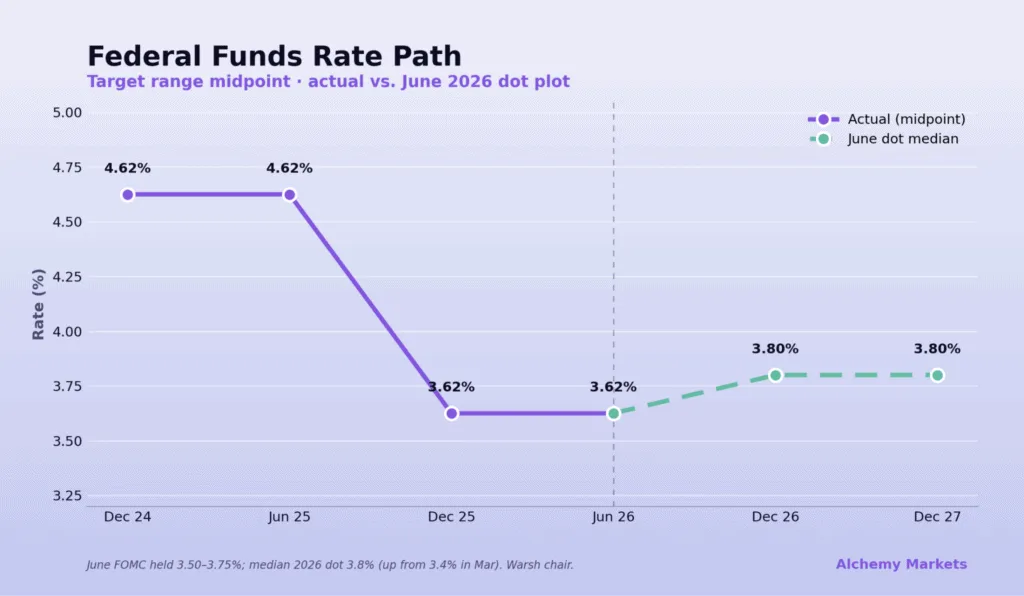
Against all of it stands the Fed. The policy rate has eased to a 3.62% midpoint, but in June the committee's own projections turned the other way — the median 2026 dot moved up to 3.80%, the easing signal gone, cuts pushed out to 2027. So the quarter sets up as a three-way tension: earnings that keep outperforming, a capex cycle funding them, and a central bank leaning against the whole thing. Five index charts are each carrying that tension in a different shape.
WEEKLY STRUCTURE · BIAS: BOUNCE, THEN HIGHER
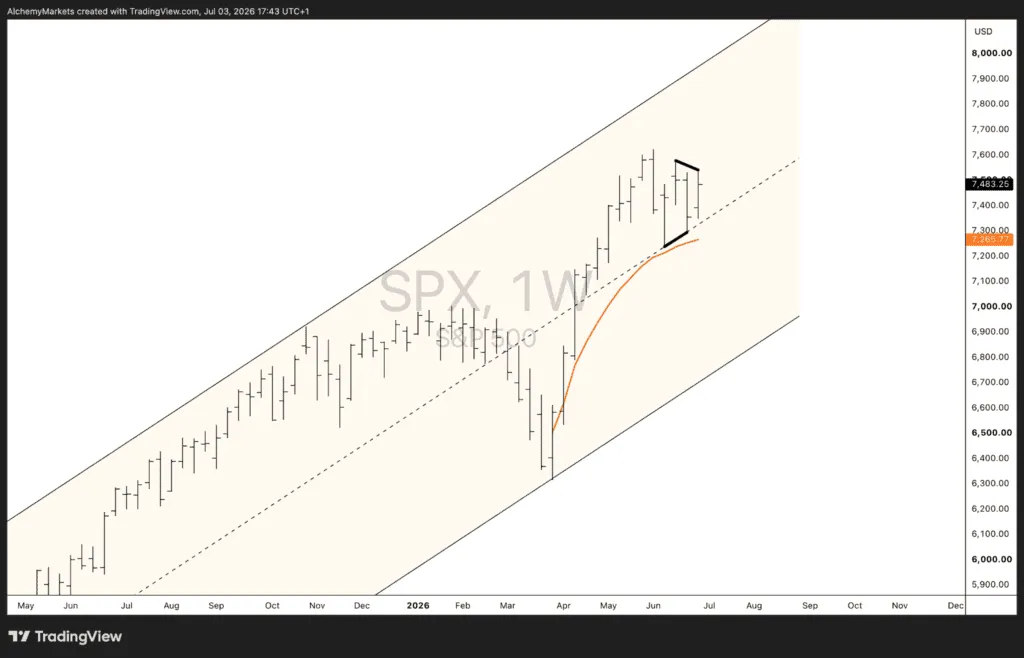
SPX enters the quarter in the upper half of a broad ascending channel that has carried the whole advance off the 2025 lows, trading around 7,499 after tagging the channel top in early June and easing back. The level that matters sits just beneath: the anchored VWAP from the April low has climbed the entire rally and now curls in around 7,259, flattening right under price. That is where the structure firms — rising channel mid-line and anchored VWAP converging into one support shelf.
The read: a bounce off the anchored VWAP completes a zigzag (ABC) correction, and the index turns higher into the back half of the quarter. The fundamental permission for that move is the more nuanced reading of the Fed. The June dot plot was hawkish on its face, but Warsh personally declined to submit a dot, has signalled he looks through supply-shock inflation, and views AI as structurally disinflationary — all while dismantling the forward-guidance apparatus itself.
In other words: the hawkishness is real but temporary in character, while the structural shift toward a less-hawkish, less-guided Fed is the more durable signal. The chart was leaning into the VWAP before that interpretation took hold; the macro simply gives the bounce somewhere to go.
DAILY STRUCTURE · BIAS: RANGE-BOUND
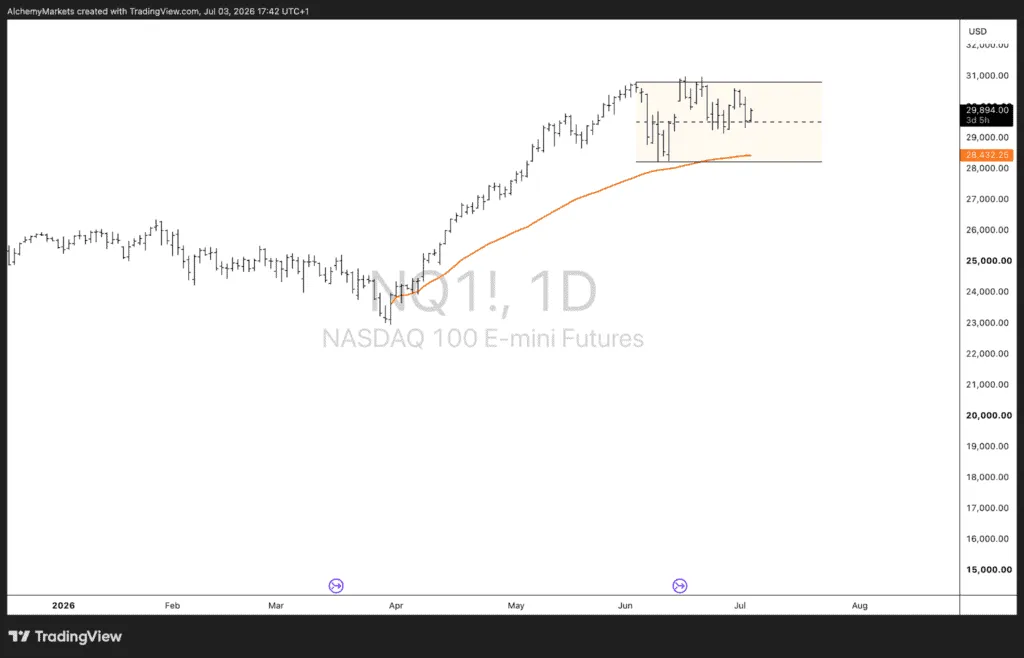
NQ is the index most directly wired to the capex story from the top of this note, and for now it is going nowhere fast — consolidating in a horizontal range beneath its highs, with the anchored VWAP flattening into the lower edge. That is not weakness; it is digestion. The trillion-dollar hyperscaler spend is the structural bid underneath, but the market wants confirmation, and confirmation arrives late-July when Big Tech reports. Until then the path of least resistance is sideways.
The base case is compression: energy building inside the range rather than releasing. A hawkish-leaning rate backdrop caps the upside, while the structural AI-spend narrative and resilient earnings cushion the downside — a recipe for chop, not trend.
DAILY STRUCTURE · BIAS: CLIMB, THEN A LATE-QUARTER EXHAUSTION HINT
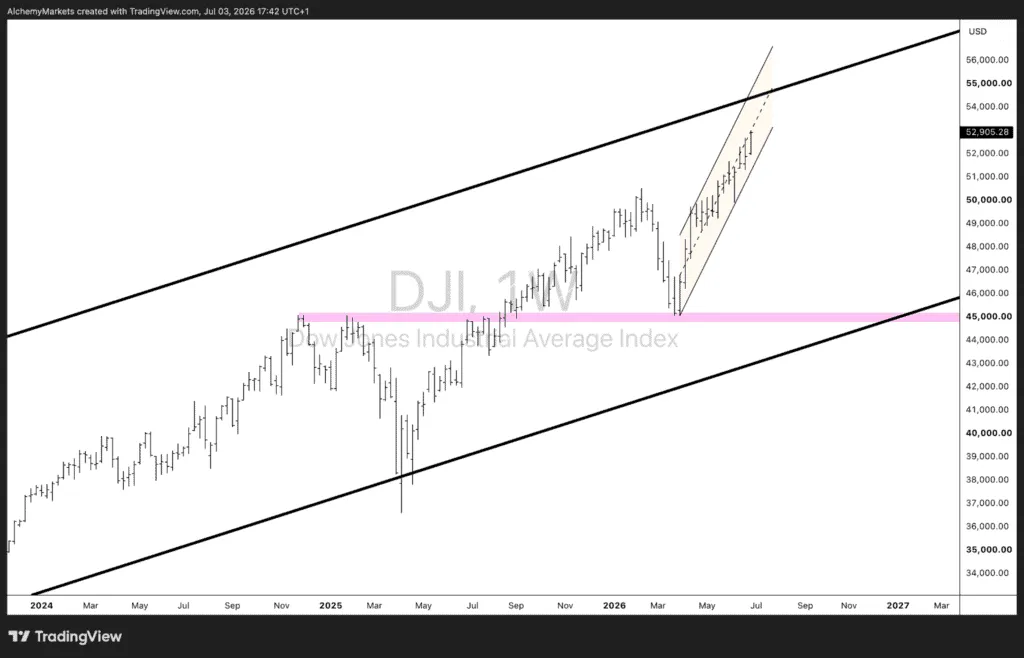
The Dow is the only one of the three printing fresh records into quarter-end, pressing 52,000 and riding the top half of the multi-year ascending channel on clean higher highs. Its lighter tech weighting, so often a drag, is the feature here: in a hawkish-rate, capex-jittery regime, the Dow's tilt toward value and rotation names is exactly what keeps it bid.
Structurally, the Dow's relative strength is a feature of its composition. Its low technology weighting insulates it from the AI-capex wobble that hangs over the Nasdaq, and its tilt toward value, industrials and financials is what tends to lead when rates stay higher-for-longer and the market rotates away from long-duration growth. In a hawkish quarter, that mix is an advantage.
The nuance for Q3: as price presses into the upper boundary of the channel, the risk-reward of chasing it deteriorates. We expect the climb to continue, but this is the quarter where the first hints of exhaustion at the upper rail could begin to show — a correction is more likely to be set up than to complete within the period.
DAILY STRUCTURE · BIAS: AWAITING A CORRECTIVE BREAK FROM THE RISING CHANNEL
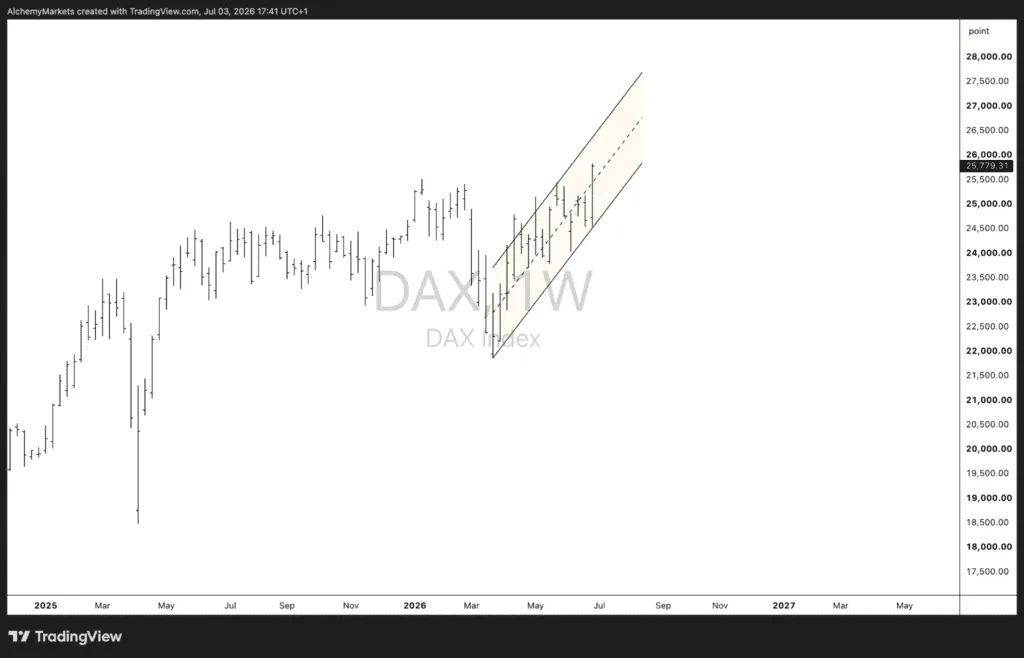
The DAX has been grinding higher inside a rising channel off the April low near 21,850, with price around 24,670 now pressing the lower boundary of that channel. Rather than chase it here, we are waiting for a corrective break out of the channel to the downside — a healthier entry sets up on a pullback into the 50% to 61.8% retracement of the April–June advance, roughly the 24,200 down to 23,900 zone.
The fuel is fiscal. Germany's loosened debt brake has unlocked a €500bn infrastructure fund plus defence spending exempted from the break, with the IMF putting the 2026 fiscal thrust at roughly 1% of GDP — the biggest break from nearly two decades of fiscal drag. The key point for an index, rather than an economy, is timing: fiscal stimulus tends to move markets when expectations turn, not when spending peaks, and that inflection appears to be approaching.
Crucially, the DAX is not the German economy. Its constituents are global multinationals, and its heaviest sectors — industrials around 27% and financials around 20% — are the direct beneficiaries of defence and infrastructure spending and of a higher-for-longer ECB. That is why a soft domestic growth print (2026 GDP consensus near 0.9%, revised down) can coexist with a re-rating in the index.
The honest counterweight: the earlier energy shock has weighed on the German recovery, US tariffs are pressuring the auto-heavy export base, and fiscal disbursement has been slow. So while the medium-term fiscal case argues higher, the near-term technical signal is to stay patient — let the rising channel break, let price correct into the 50%–61.8% zone, and use that pullback as the lower-risk entry where the fiscal re-rating becomes the fuel for the next leg up.
DAILY STRUCTURE · BIAS: BULL FLAG, RESOLVING HIGHER
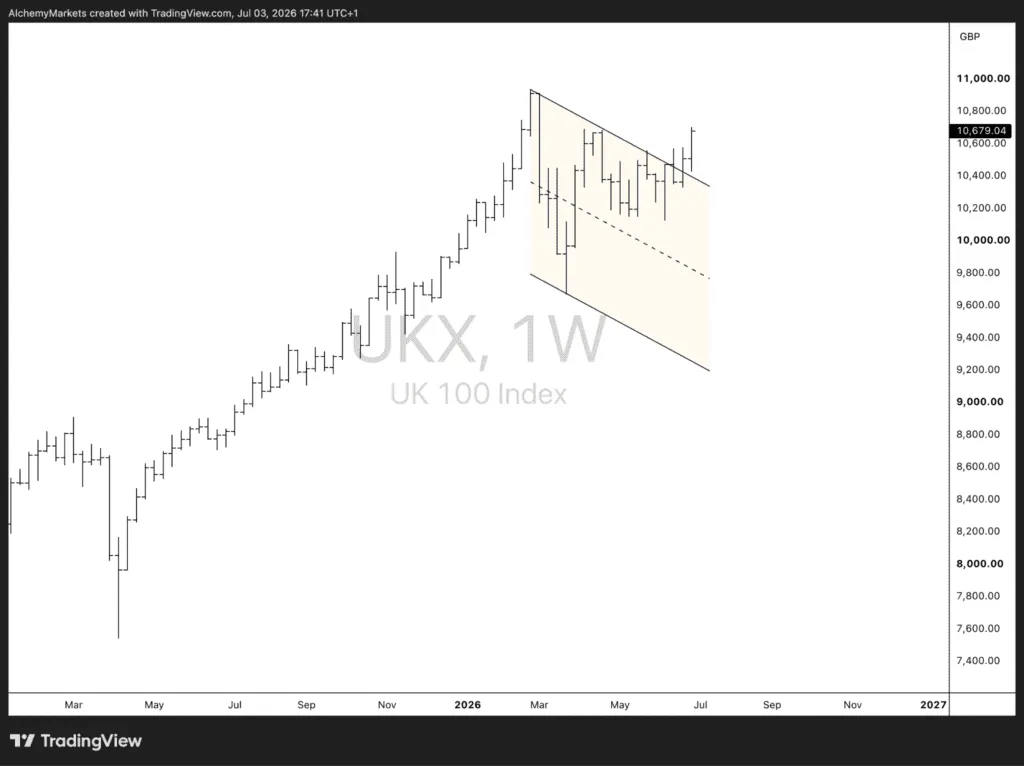
The FTSE presents the quarter's most counterintuitive setup. Price near 10,466 sits inside a descending channel off the March high near 10,940 — but read as a bull flag: a corrective, orderly consolidation after the strong December-to-March advance, the kind of pause that refreshes rather than tops. A break of the flag resolves the prior trend higher.
The paradox is that the UK has arguably the worst macro backdrop in the G20 — the largest growth downgrade and inflation heading toward 4% — yet the index is built almost perfectly for exactly that regime. The reason is that the FTSE is not a UK trade. Roughly 75–80% of its revenue is earned overseas, so global PMIs, China and the dollar matter far more to index earnings than domestic GDP. Reading the FTSE through a UK lens consistently produces the wrong conclusion.
Its composition is the edge. The heavy energy and mining weighting turns the oil spike into a tailwind rather than a liability; roughly 54% of 2026 pre-tax profit comes from just three sectors — financials, oil & gas, and mining. A record ~£88bn in forecast dividends provides a valuation floor that pure growth indices lack, and a softer pound — the likely consequence of weak UK growth and sticky inflation — lifts the translated value of those overseas earnings. Defensive, commodity-geared and income-rich is precisely the profile that outperforms in a hawkish, volatile, AI-jittery quarter.
The caveat worth stating: after a strong run the index is no longer deeply discounted, and it lacks a clear domestic growth catalyst — it often does well simply because investors are bearish on everything else. But in a Q3 defined by exactly that kind of caution, the lack of a tech engine becomes the FTSE's feature, not its flaw.
Five indices, five structures, one backdrop. The US trio fans out by composition: SPX bouncing off confluence support as the market looks past a temporarily hawkish Fed, NQ coiling sideways until Big Tech earnings force a hand, and DJI grinding toward the top of its channel on value-rotation resilience. Across the Atlantic, both European indices lean higher for fundamentally opposite reasons — the DAX on a domestic fiscal re-rating, the FTSE on its near-total detachment from the domestic economy.
The unifying discipline is the same one that opened this note: the chart leads, the macro confirms. In every case the structure was in place before the fundamental story crystallised. The job through Q3 is to let the levels do the talking and use the macro to judge which way the breaks are most likely to resolve.
Alchemy Markets is a multi-asset brokerage providing retail traders with the same elite trading conditions, tools, and transparency typically reserved for institutions.
Select the categories and companies you wish to follow directly to your person rss feed.
Create Custom RSS Feed
just now
Sign up and join over 5,000 professional members who receive personalized news alerts, curated professional connections, and more for free!
The Award represents the latest milestone in PLUGIT's strategic evolution toward becoming a leading Brokerage Technology Provider, delivering one connected trading technology solution for modern brokerages.
Want to find the best reversal chart patterns before they happen? Learn how to identify bullish and bearish reversal patterns and confirm trades.
The YOONIT Broker Technology Solution by PLUGIT.
Brokers replacing fragmented tools with connected ecosystems are gaining real competitive advantage. Discover how YOONIT makes it possible.
Explore how YOONIT Copy Trade solution gives brokers the visibility and control to run revenue driven copy trading activities.
dxFeed has launched dxScript, a JavaScript-based scripting language for technical analysis with native AI integration. The platform lets traders generate custom indicators from plain-language descriptions via a built-in AI assistant, running on dxFeed's award-winning Market Data Infrastructure as a Service.
GTN and Payward have partnered to expand the xStocks tokenised equities framework beyond U.S. markets, starting with Hong Kong-listed equities before extending to the UK, Europe, and South Korea, with plans to broaden into new tokenised asset classes subject to regulatory approvals.
Citadel Securities has opened a new Amsterdam office to serve as its European equity options hub, bringing together trading, technology and quantitative research teams. Dave Silber, Head of Institutional Equity Derivatives, said the move strengthens the firm's investment in Europe's capital markets.
MetroTrade has launched options on futures trading in partnership with Devexperts, giving traders access to CME-listed options on futures via the MetroTrader platform. The integration adds options chain, earnings analyser, and multi-leg options tools within a single account interface.
MEXC has appointed Robert MacDonald as Chief Compliance Officer, joining from Bybit where he served as Chief Legal & Compliance Officer. He previously held senior roles at Standard Chartered and Binance, and will lead MEXC's global compliance strategy as the exchange expands beyond crypto trading.