just now


Liquidity Finder Ltd is incorporated in England and Wales, company number 10610740, registered address 167-169 Great Portland Street, Fifth Floor, London W1W 5PF, United Kingdom.
Published: just now


The WTI crude oil price forecast points to potential bullish continuation after price showed strong rejection at weekly support and broke above the daily resistance zone. The breakout strengthens the possibility of an upward move toward 100.305, provided buyers maintain control and the reclaimed resistance holds as support.
Previously, crude oil was consolidating between weekly support at 87.360–90.830 and daily resistance at 92.875–94.765. The weekly chart showed strong buying interest at support, while the daily chart remained constrained beneath resistance.
The latest price action has changed the technical outlook. With price breaking above daily resistance, attention shifts toward whether buyers can defend the reclaimed zone and extend the move toward 100.305.

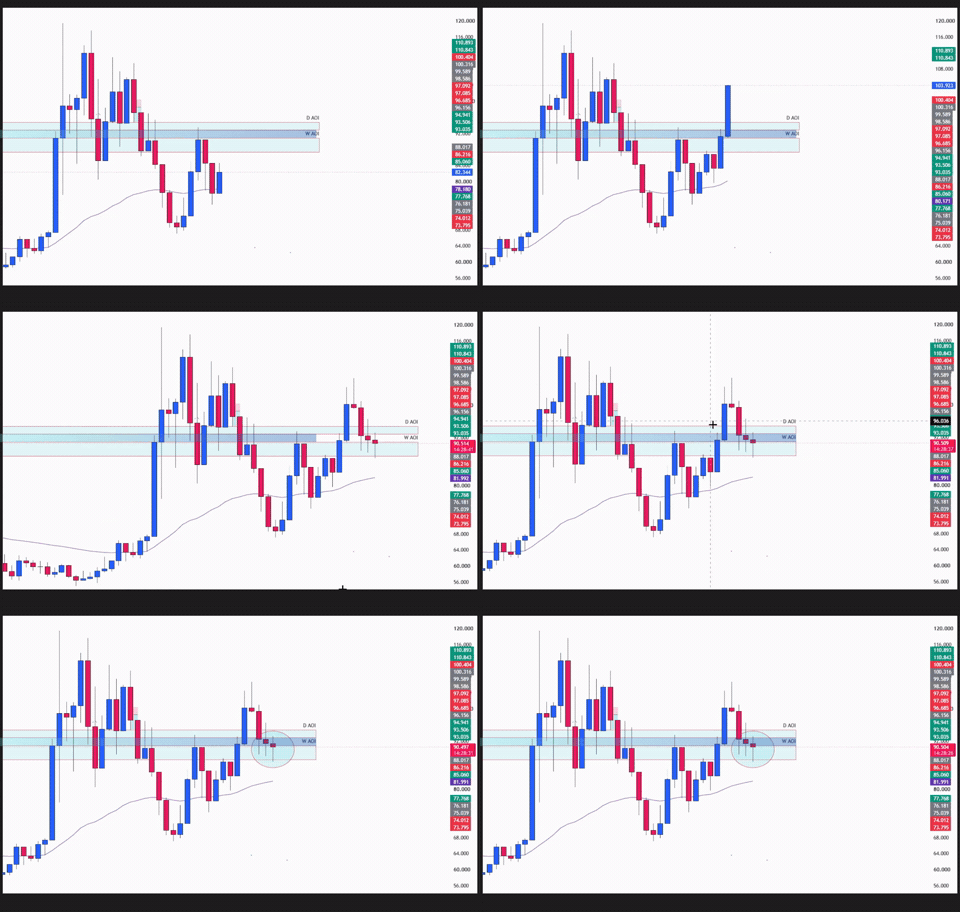
The weekly crude oil chart continues to show a broader bullish trend, with price displaying strong rejection at the 87.360–90.830 support zone.
Weekly Timeframe Price Action Analysis: Potential Higher Low at Support Before the Bullish Breakout
This reaction suggests that buyers were defending the support area, supporting the possibility of a higher low forming within the broader uptrend. Price was also trading above the weekly 50 EMA, providing additional context for the bullish outlook.
Understanding market structure and the direction of a market trend helps traders distinguish a potential higher low from confirmed trend continuation.
Key weekly observations from the original setup included:
The weekly support reaction established the bullish continuation scenario, but the market still needed to clear resistance before the outlook could strengthen.
The weekly analysis also identified rejection around the inverted head and shoulders neckline.
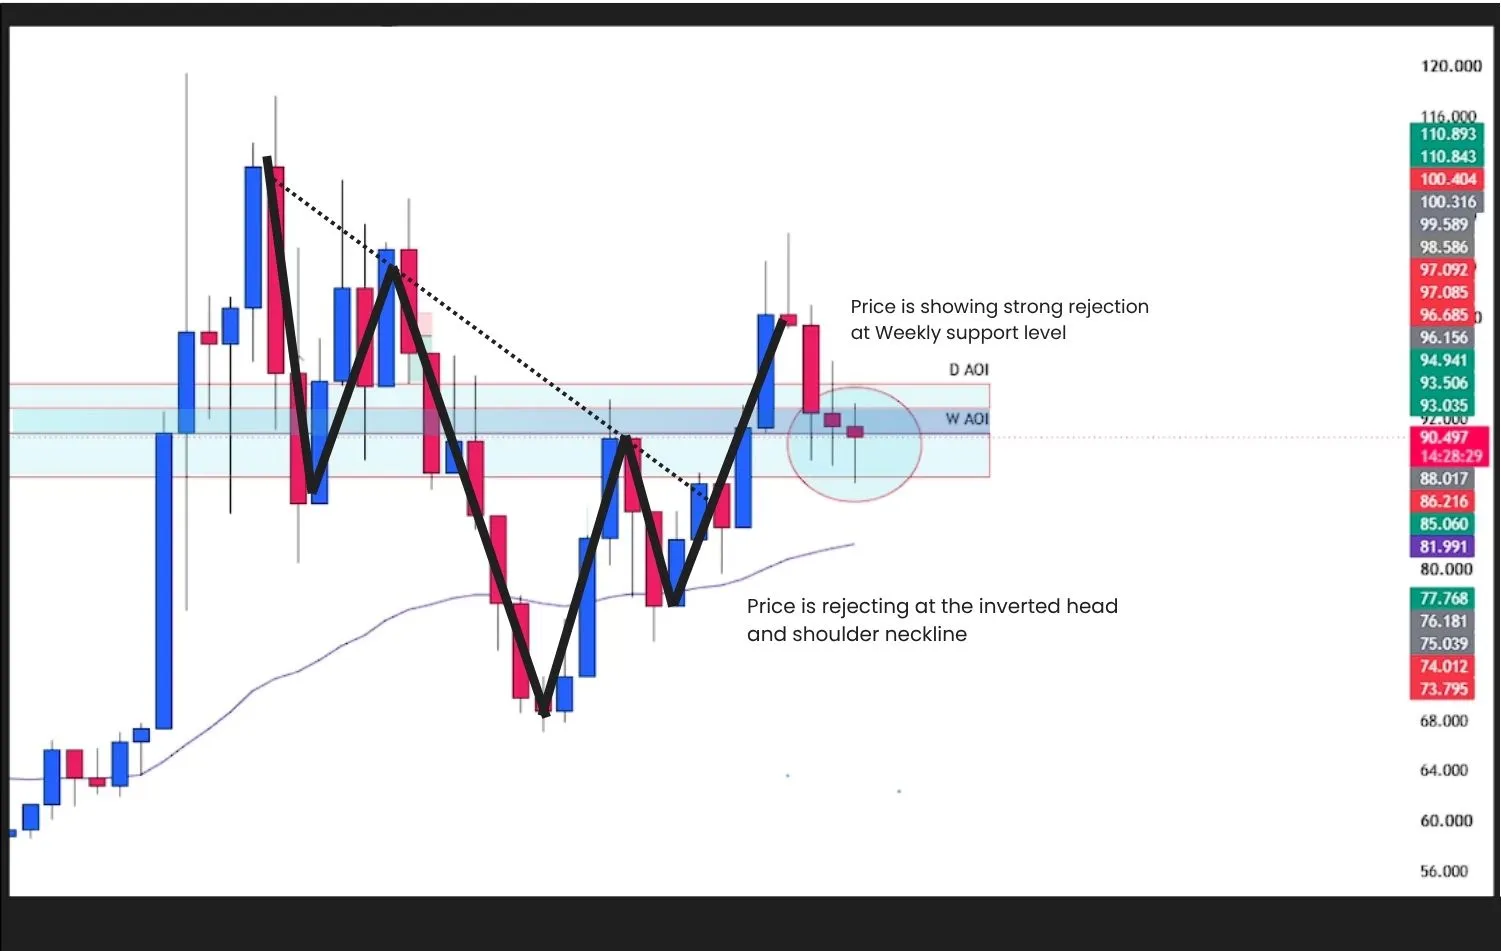
Weekly Chart: Inverted Head and Shoulders Neckline Retest
If price breaks above the neckline and subsequently retests it from above, buyers defending that retest would support the bullish outlook.
A neckline touch alone does not confirm continuation. Traders should look for the following sequence:
A pronounced lower wick can indicate rejection of lower prices. Combining this candlestick confirmation with the potential higher low and price holding above the weekly 50 EMA would strengthen the continuation case.
Weekly confirmation sequence: Neckline breakout → retest from above → bullish weekly close → upward follow-through.
The neckline provides additional context, while the daily resistance breakout remains a separate confirmation requirement. The 100.305 level is the supplied upside target, not a calculated head and shoulders measured-move target.
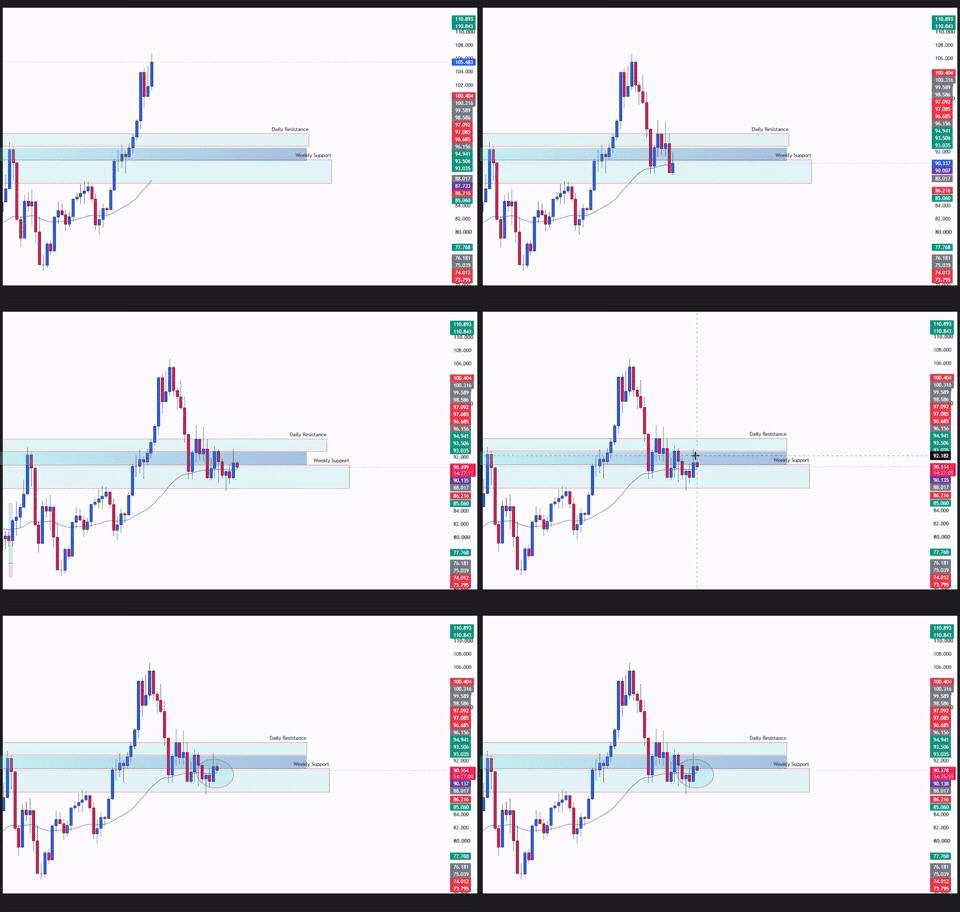
In the original analysis, the daily crude oil chart retained a bearish market structure while price consolidated between weekly support and daily resistance.
Daily Timeframe Price Action Analysis
At that stage, price was trading above the daily 50 EMA, suggesting improving short-term momentum. However, the moving average alone was insufficient to confirm a reversal of the bearish daily structure.
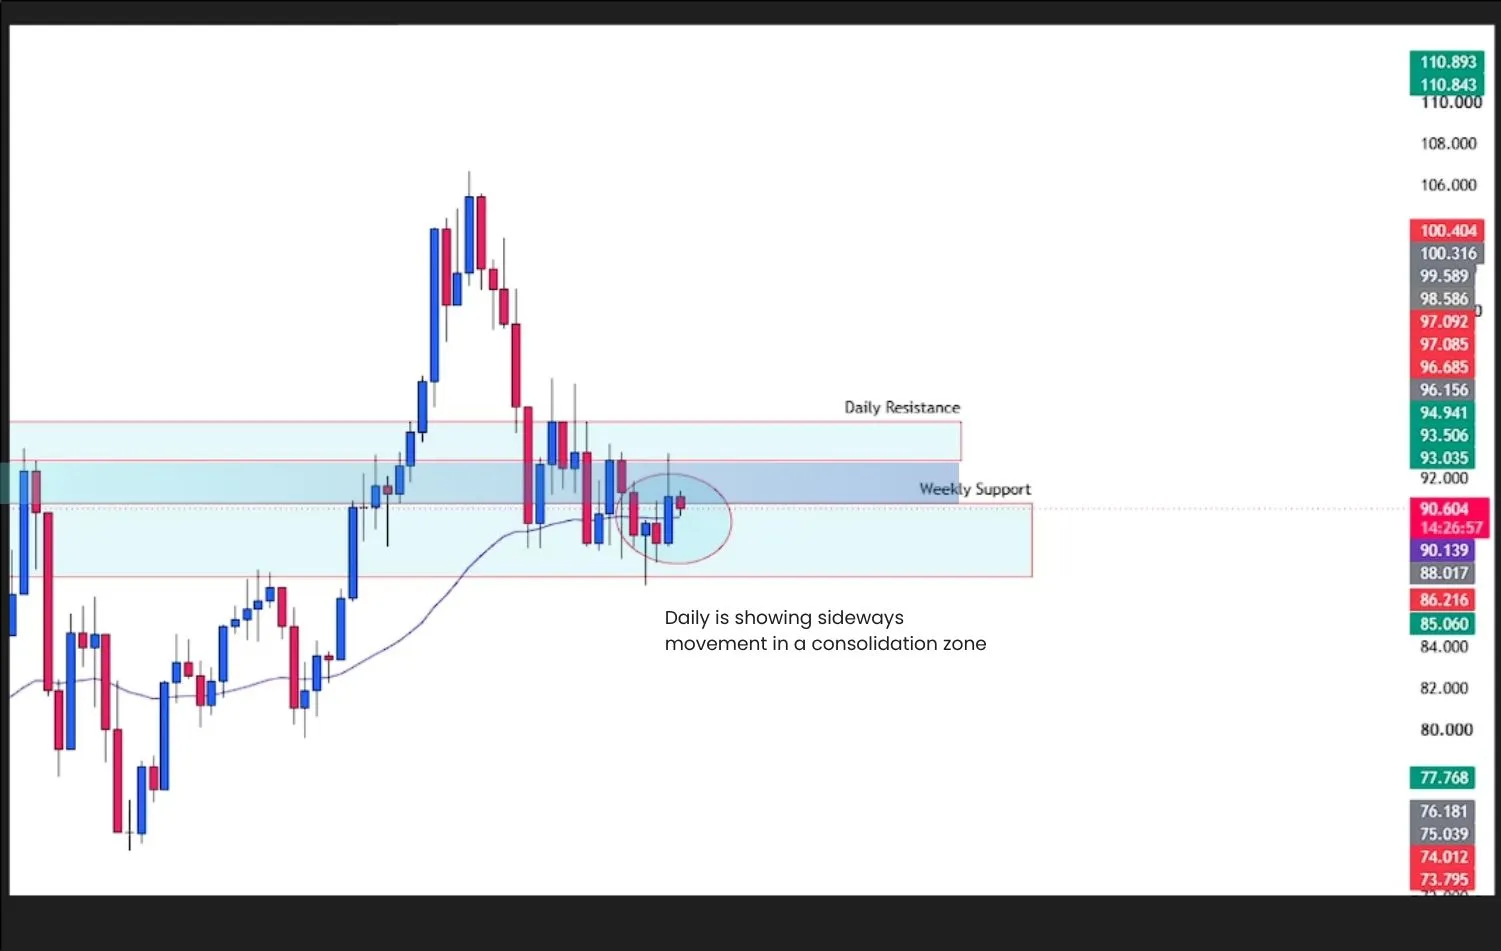
Daily Timeframe Price Action Analysis: Consolidation Below Resistance Before the
Bullish Breakout
The key resistance zone remained 92.875–94.765, and a confirmed break above the previous daily lower high was needed to strengthen the case for a structural shift.
The latest price action has now changed this setup.
Price has broken above the 92.875–94.765 daily resistance zone, signaling improving bullish momentum and strengthening the possibility of further upside.
The former resistance zone is now the key area to monitor for potential support. A successful retest, supported by bullish price action and upward follow-through, would provide additional evidence that buyers are maintaining control.
Traders can study break and reteast price action patterns to understand how former resistance can become support after a breakout.
WTI crude oil has strengthened following its earlier rejection at weekly support, with price advancing toward the 100.305 upside target identified in the technical analysis.
The previous daily resistance zone between 92.875 and 94.765 was the key barrier for buyers. Price has since advanced above this zone, making the latest daily close and subsequent price reaction important for confirming whether bullish momentum can continue.

Daily Timeframe Price Action Analysis: Latest Price Action Following the Bullish Breakout
The current price action puts the market at an important technical decision point. If price sustains a daily close above 94.765, the former resistance zone could provide support during a pullback. A successful retest followed by bullish confirmation would strengthen the continuation scenario toward 100.305.
However, if price fails to hold above the breakout zone and moves back below 92.875, the bullish breakout could weaken. Traders should then watch for renewed consolidation and a possible move toward the weekly support zone at 87.360–90.830.

Weekly Timeframe Price Action Analysis: Current Price Action Following Rejection at Weekly Support
The weekly chart provides the broader context for the move. The strong rejection at 87.360–90.830 established the initial bullish scenario, while the subsequent advance above daily resistance showed buyers attempting to extend the move.
The latest price action should be assessed against three key conditions:
The potential upside target remains 100.305, but price must demonstrate sustained bullish momentum before that level becomes a more credible continuation objective.
Identifying support and resistance levels helps define where the next market scenarios could develop.
| Technical levelSignificance |
| 87.360–90.830Weekly support zone where buyers previously showed strong rejection |
| 87.360Lower boundary of weekly support; a confirmed break would weaken the bullish outlook |
| 92.875–94.765Former daily resistance zone, now the key area to monitor for support |
| 94.765Upper boundary of the former resistance zone |
| 100.305Potential upside target if bullish continuation is confirmed |
| Weekly 50 EMADynamic support reference for the broader bullish trend |
| Inverted head and shoulders necklineAdditional weekly confirmation area |
| Previous daily lower highStructural reference for assessing a bullish trend shift |
A move into a zone is not the same as a break through it. A sustained move above 94.765 strengthens the breakout case, while a move below 87.360 would break the full weekly support zone.

Daily Timeframe Price Action Analysis. Bullish Bias Anticipation
The bullish scenario has strengthened following the daily breakout above 92.875–94.765.
If crude oil pulls back toward the reclaimed zone and buyers successfully defend it, the former resistance could act as support. A bullish rejection candle or bullish engulfing pattern would provide additional evidence that buyers remain in control.

Daily Timeframe Price Action Analysis. Bullish Take Profit and Stop-loss Placement
The bullish confirmation sequence is:
Traders can strengthen their analysis by learning how to identify and trade high-probability price action setups at key levels. Combining market structure, support and resistance, and candlestick confirmation provides a structured approach to evaluating whether buyers are defending the breakout.
This scenario aligns with the weekly rejection at support and the broader bullish trend.
However, a daily close back below 92.875 would weaken the breakout setup and increase the possibility of renewed consolidation. Even after a confirmed breakout, a false move remains possible.

Daily Timeframe Price Action Analysis. Bearish Bias Anticipation
Despite the bullish breakout, the continuation scenario remains conditional on price holding above the reclaimed resistance zone.
If crude oil falls back below 92.875 and fails to recover, the breakout could prove unsuccessful. This would weaken the immediate bullish outlook and could lead to renewed consolidation.
A sustained decline could then bring the weekly support zone at 87.360–90.830 back into focus.

Daily Timeframe Price Action Analysis. Bearish Take Profit and Stop-loss Placement
For a stronger bearish case, traders should monitor:
Understanding false breakouts and how to avoid breakout traps can help traders evaluate situations where price briefly moves beyond resistance but fails to sustain the move.
A confirmed break below 87.360 would signal that sellers have broken through the full weekly support zone, significantly weakening the current bullish continuation scenario.
WTI crude oil has strengthened its bullish outlook after showing strong rejection at weekly support and breaking above daily resistance.
The original analysis identified a potential higher low at weekly support and highlighted 92.875–94.765 as the key daily resistance zone. The latest breakout represents a development beyond that initial setup, shifting attention toward whether buyers can sustain the move.
If buyers defend the former resistance zone during a retest and bullish momentum continues, crude oil could extend toward 100.305. However, a return below 92.875 would weaken the setup and could lead to renewed consolidation.
For buyers, the focus is on holding above the reclaimed resistance zone, confirming the retest, and maintaining upward follow-through.
For sellers, the focus is on a failed breakout, a return below the reclaimed zone, and a potential move toward weekly support.
Until price action confirms the next direction, traders should avoid treating the upside target as guaranteed.
Watch the breakout. Wait for the retest. Let price confirm the direction.
_____________________________________________________________________________________
Move from learning price action to applying it in the real market.
Trade:
Access trading platforms and tools including ACY, MT4, MT5, and Copy Trading.
Create an Account and Start Live Trading
_____________________________________________________________________________________
Build your trading foundation with these step-by-step guides:
Learn to read price action and assess trading setups at key levels:
Learn to recognize bullish, bearish and sideways markets:
Learn to mark key levels and interpret price reactions:
Understand recurring price patterns, retests and false breakouts:
Learn to combine candlestick signals with price action analysis:
Learn to recognize patterns that may signal a change in market direction:
Explore how to combine the exponential moving average with price action:
Bring your technical analysis skills together through a gold swing trading guide:
Learn how risk management and position sizing fit into your trading plan:
Learn how to plan take-profit targets using market structure and risk-reward:
Develop discipline, emotional awareness and a more consistent trading process:
Explore the psychological habits behind a disciplined trading approach:
_____________________________________________________________________________________
Not sure where to begin? Here’s a simple roadmap to guide you:
By building step by step; from basics → real trading → mastering the craft, you’ll gain clarity, confidence, and steady progress without ever feeling overwhelmed.

_____________________________________________________________________________________
Follow Ruffy Grant B. Capacio for Gold analysis, Forex trading ideas, price action education, trading psychology, and market insights: LinkedIn
ACY Securities: Join the Discord Server
Disclaimer:
Trading Forex, Gold, CFDs, cryptocurrencies, commodities, indices, and other leveraged financial instruments involves a high degree of risk and may not be suitable for all investors or traders. Market conditions can change rapidly, and leveraged trading can result in losses that occur quickly.
Before trading, carefully consider your investment objectives, level of experience, and risk tolerance. Only trade with capital you can afford to lose and seek independent financial or professional advice where appropriate.
All market analysis, price forecasts, technical commentary, trading scenarios, educational materials, and opinions presented in this content are provided solely for general informational and educational purposes. They do not constitute financial advice, investment advice, a recommendation, solicitation, or an offer to buy or sell any financial instrument.
Past performance and historical price movements are not reliable indicators of future results. Any price levels, targets, scenarios, or market outlooks discussed should be viewed as analysis rather than guarantees of future market performance. October 14, 2026
ACY Securities is one of Australia's fastest growing multi-asset online trading providers, offering ultra-low-cost trading, rock-solid execution, technologically superior account management and premium market analysis.

Select the categories and companies you wish to follow directly to your person rss feed.
Create Custom RSS FeedSign up and join over 5,000 professional members who receive personalized news alerts, curated professional connections, and more for free!
LSEG has announced a collaboration with NVIDIA that lets financial institutions analyse years of LSEG Tick History data in seconds using NVIDIA cuDF on GPUs, without creating another full copy of the dataset. Tick History holds 110 trillion rows across 100 million instruments and more than 580 venues and contributors.
Standard Chartered has launched a cryptocurrency trading solution letting eligible affluent clients buy and sell Bitcoin and Ether through existing bank accounts. Built with Zodia Markets and regulated by VARA, it launches first for Professional Investor clients in the UAE, with other markets to follow over time.
WTI crude oil breaks above daily resistance after rejecting weekly support. Explore key price levels, breakout confirmation, and the potential 100.305 target.
IG Prime has confirmed Investec Prime Services as a new partner for its institutional white label solution, giving institutional clients in South Africa access to IG’s multi-asset global trading platform under the Investec Prime Services brand. The offering spans equities, indices, FX, commodities and fixed income.
PLUGIT announcing a new YOONIT UX/UI experience coming across all six modules.
The AI conversation in brokerage risk management is mostly led by vendors. Here is what a dealing desk actually needs to know — before signing anything.
The cost of capital is becoming a defining force in global markets. But are investors pricing in the full impact? With the Fed's policy outlook under scrutiny, major bank and semiconductor earnings approaching, and key inflation data on the horizon, markets face a critical week. In this week's BitDelta Pro Weekly Outlook, we explore the signals shaping market expectations and the factors that could challenge the prevailing narrative.
September's US inflation report could be a defining moment for the Federal Reserve's next interest rate decision. With headline inflation expected to accelerate while core inflation remains steady, the growing divergence raises an important question: Is inflation pressure becoming more widespread, or is energy driving the narrative? Ahead of the October 14 CPI release, BitDelta Pro Research examines the forces shaping inflation expectations, the signals policymakers may prioritise, and what the data could mean for the Fed's next move.
BingX has launched US stock trading through an integration with Alpaca, giving eligible users access to more than 7,000 US stocks and ETFs. Trades can be funded with USDT and USDC, start from $5 and run 24 hours a day, five days a week. A $200,000 Stocks Mystery Box promotion runs from 9 to 23 October 2026.
Bybit has opened stocks trading to eligible users, offering access to more than 1,000 U.S.-listed stocks and ETFs funded in USDC. Orders are executed through Alpaca, with 24/5 trading, fractional shares and zero commission on eligible trades, plus support for dividends and stock splits. Users must complete KYC checks.