Search Companies, News, Members & more
Terms of ServicePrivacy PolicySecurity PolicyLegal InformationCommunity GuidelinesSitemapsCookie Settings
2026 Copyright © Liquidity Finder Ltd. All rights reserved.
Liquidity Finder Ltd is incorporated in England and Wales, company number 10610740, registered address 167-169 Great Portland Street, Fifth Floor, London W1W 5PF, United Kingdom.
The State of Liquidity in Crypto Markets Q1 2023
Published on Apr 16, 2023
Updated on Mar 7, 2026


Conor Ryder is a Research Analyst at Kaiko Research. Kaiko is the leading source of cryptocurrency market data, providing businesses with industrial grade and regulatory compliant data
March 23, 2023 - Crypto markets are at their most volatile when liquidity is low. Prices have less support to both the downside and the upside, which could explain BTC’s rapid +17% surge since the start of the month. Liquidity has also become a hot topic in traditional financial markets as the banking sector reels from several high-profile collapses. This has in turn trickled down to crypto, which was already suffering from a dearth of liquidity in the aftermath of FTX.
In this article I’ll examine the state of liquidity in crypto markets by looking at market depth, spreads, slippage and volumes, while outlining the key liquidity hurdles the industry needs to overcome in the near future.
Market Depth
Market depth is arguably the most relevant gauge of liquidity in crypto markets as it represents the amount of orders actually waiting to be filled within a certain price range. By summing both bids and asks within 1% of the mid price for the top 10 assets in crypto, we get a good barometer of liquidity in markets. A quick note on the data: we have started using 1% market depth to avoid potential manipulation of the 2% depth metric we uncovered which is used widely by price display websites.
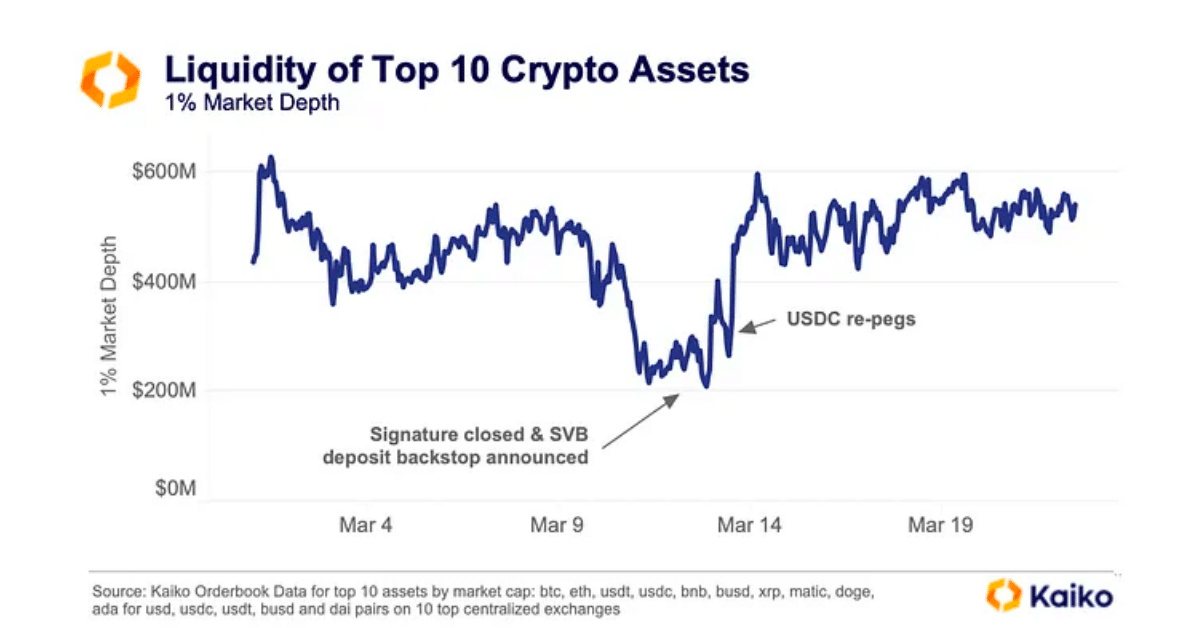
The above chart serves as a timeline for the liquidity events of the last month, with a $200mn drop around March 4th when Silvergate issues first arose and the SEN network was closed soon after. The next big dip happened when SVB and Signature collapsed, resulting in Circle’s reserves being called into question. Both SEN and Signature’s Signet payment network were two critical pieces of infrastructure for market makers in the space, providing 24/7 access to USD settlements with trading firms, OTC desks and other crypto firms. Following the closure of both of these networks, the liquidity situation in crypto hangs in the balance as the industry awaits a viable alternative (I talked about what could happen if no alternative appears in a piece for Coindesk this week).
The USD measure of market depth above fails to really capture the hesitance of market makers adding liquidity due to the rally in crypto prices in the last week, restoring USD liquidity metrics to their levels pre banking issues. One way to deal with this is to show market depth in native units to see if there has truly been a fresh injection of liquidity, or if it is just a price increase of the orders already on order books.
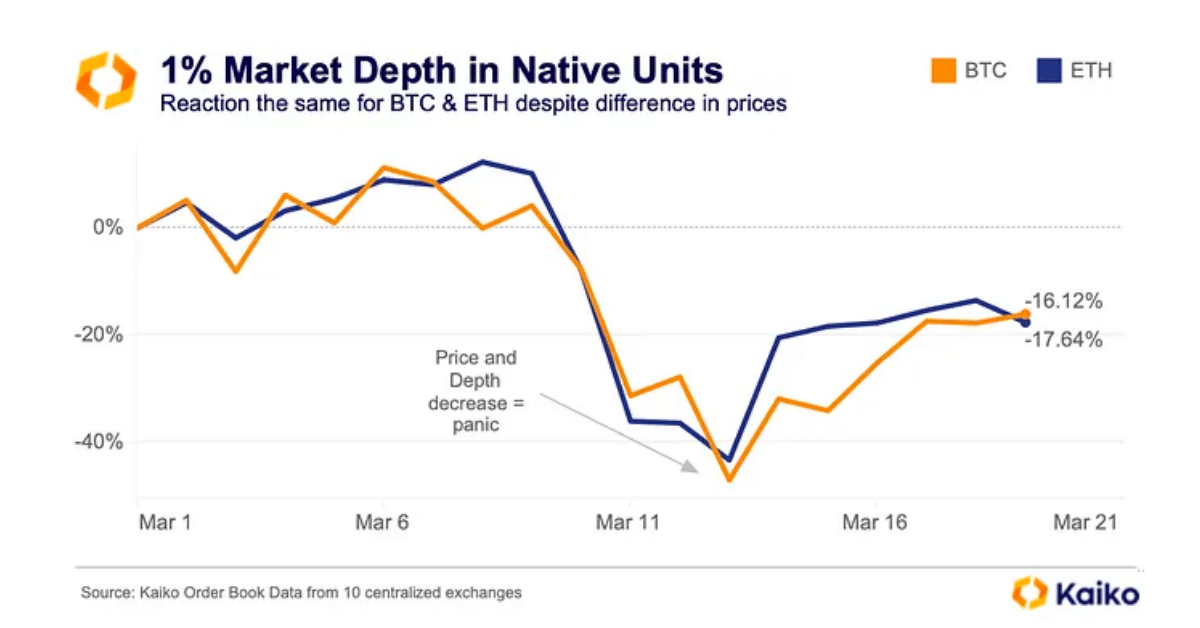
We can see that when denominated in native units, neither BTC or ETH have improved in depth, showing that this was purely a price driven increase in liquidity, which is a less sustainable way to increase liquidity in markets. Interestingly, market makers did not treat BTC and ETH any differently, despite the general rotation we’ve seen into BTC in the last week.
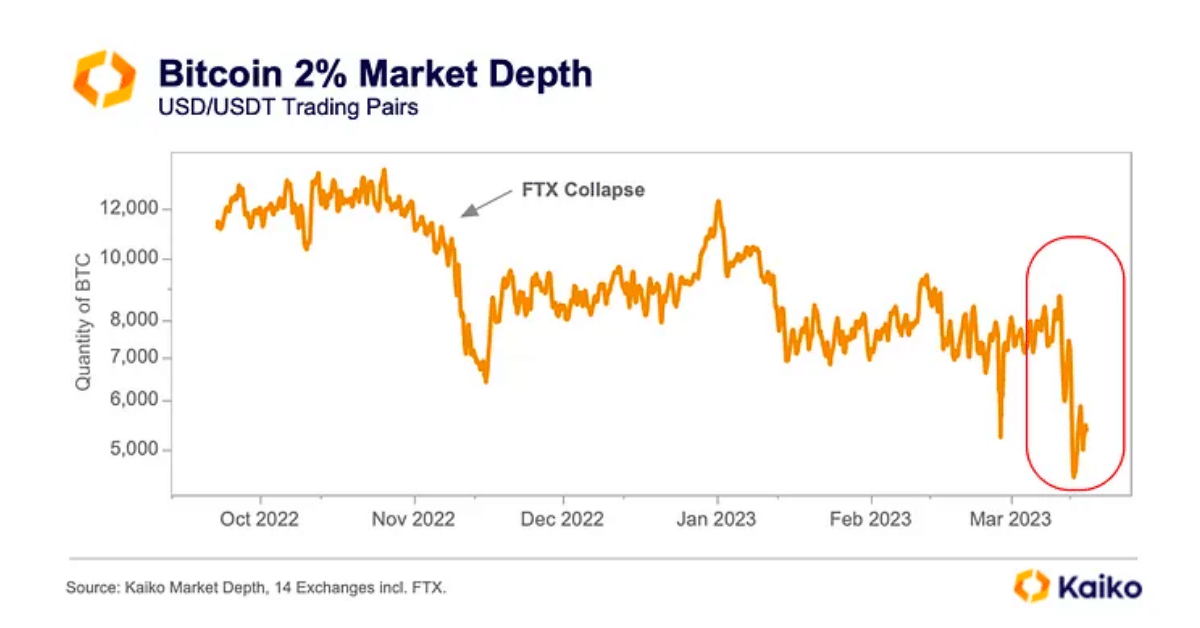
Zooming out over the last few months, market depth in BTC paints a cautionary picture. We are currently at our lowest level of liquidity in BTC markets in 10 months, even lower than the aftermath of FTX. Back when the FTX/Alameda entity collapsed, we first identified the drop in liquidity as “the Alameda Gap”, highlighting the absence of one of the industry’s biggest market makers. That gap has yet to be filled, and with the banking issues of late, liquidity has taken another blow.
The closure of SEN and wind-down of Signet, some of the only USD payment rails for crypto, resulted in U.S exchanges being harder hit from a liquidity standpoint as market makers in the region face unprecedented challenges to their operations.
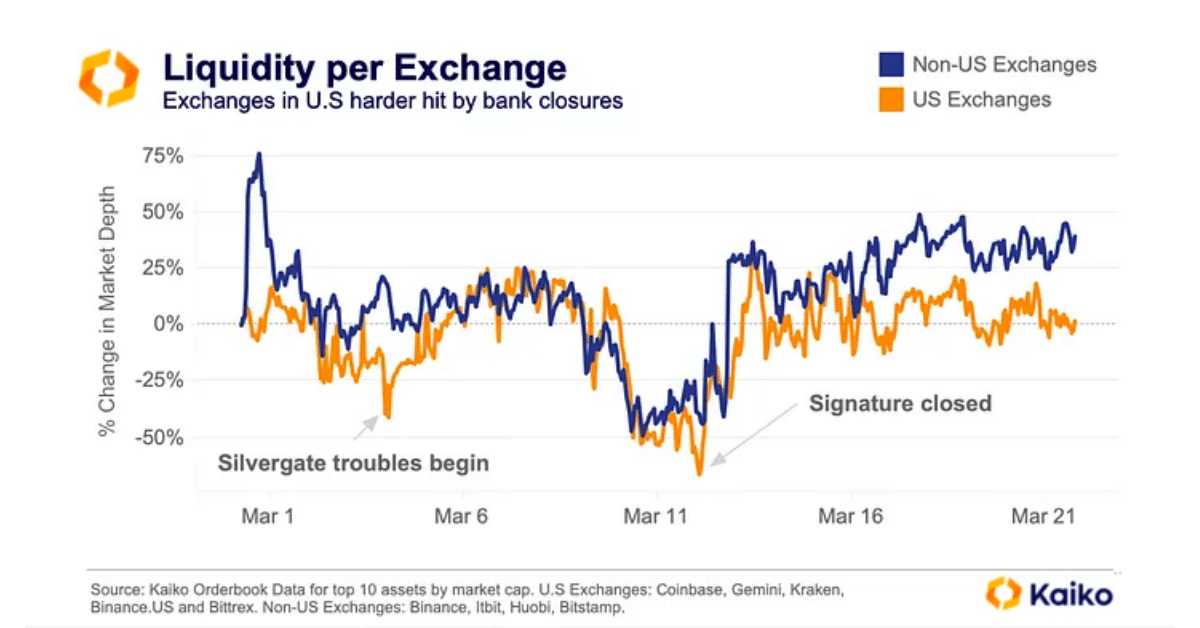
We can see the difference in reaction between US and non US exchanges with more severe reactions to some of the liquidity issues of the last month. The good news is that liquidity seems to have recovered to early-March levels, although the loss of easy fiat on-ramps could have a more long term impact.
Spreads
Another way to measure liquidity in markets are spreads offered on exchanges i.e the difference between the best bid and the best ask. Looking at USD v USDT pairs, we can see that USD spreads were more volatile as the banking issues worsened, spiking from 2bps all the way to 4bps as Silvergate was shut down.

As was the case with market depth, liquidity worsened for USD linked exchanges and pairs as the logistical issues surrounding the closure of fiat payment rails became clear. The longer it takes for a viable alternative to the SEN or Signet networks to appear, the more volatile we can expect spreads and depth to be as market makers face new operational challenges, pulling liquidity off exchanges until they can get more clarity.
Looking away from the banking issues this month, Binance announced that they were stopping the zero fee program for BTC trading pairs (apart from the BTC-TUSD pair, which we’ll explore in next week’s Data Debrief).
The importance of this event on market liquidity is not to be understated — Binance is the most liquid exchange and the btc-usdt pair is the most liquid pair in crypto. The zero fee program allowed Binance to gain over 20% in market share since July, with over 61% of volumes coming from zero fee pairs. We can see the adjustment in spreads as the previously volatile BTC spreads on Binance, thanks to a lack of taker fee, plummeted once a fee was reintroduced, bringing BTC spreads lower than ETH spreads.
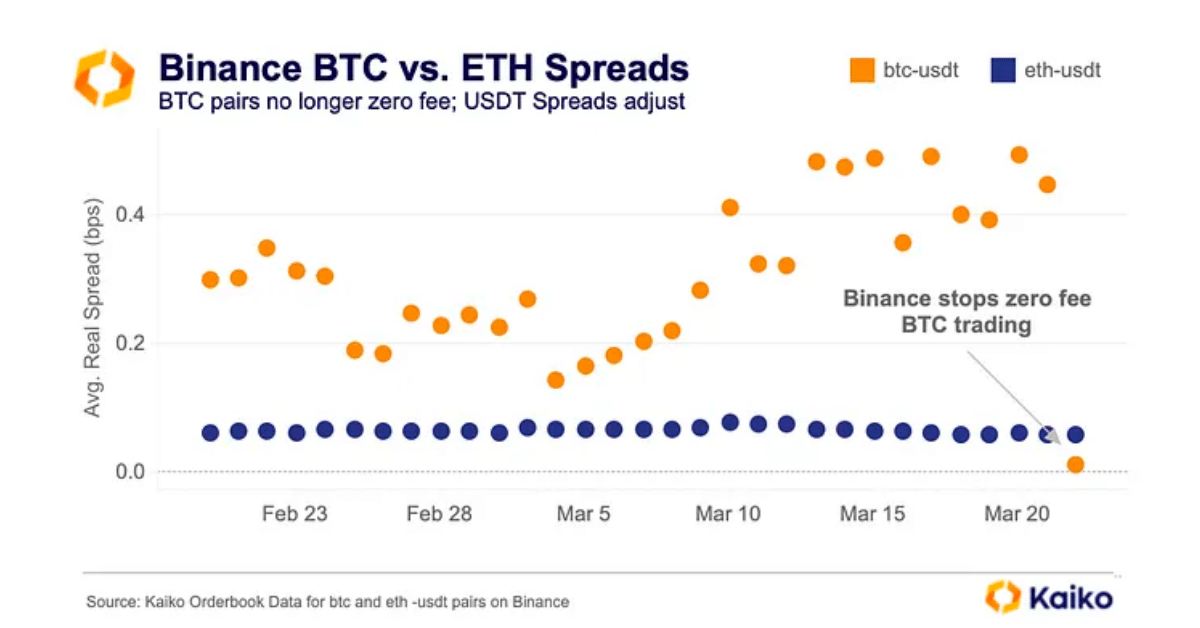
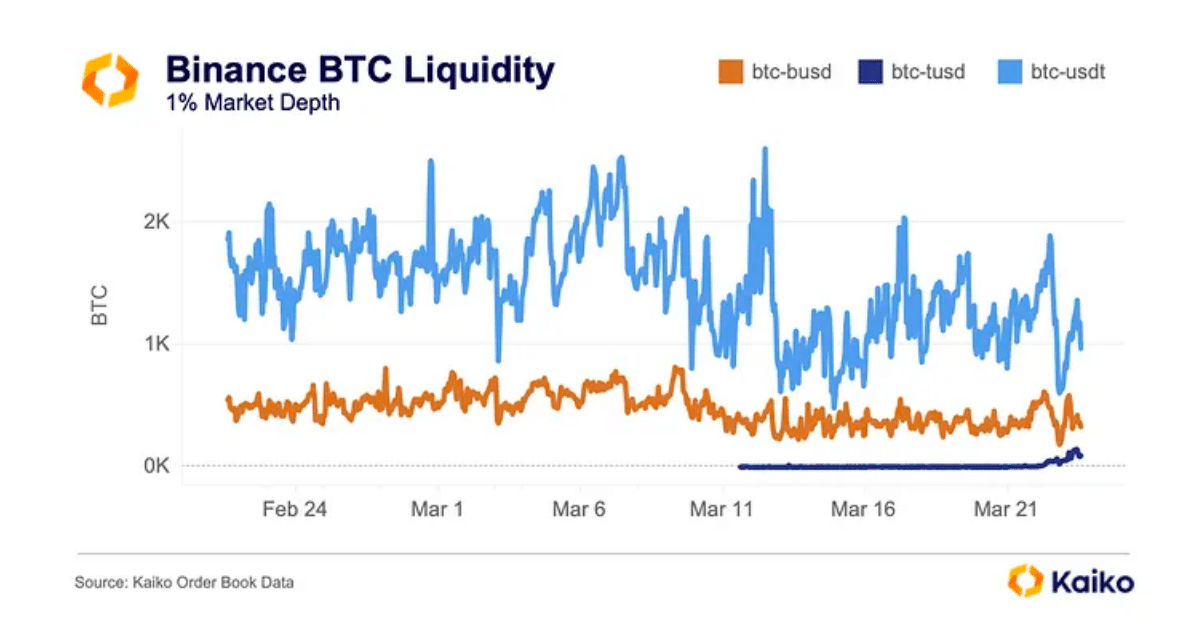
Tighter spreads make it less profitable for market makers to offer liquidity on that pair — with a taker fee being reintroduced investors aren’t willing to pay a higher spread. That has meant that liquidity has depleted from the BTC-USDT pair on Binance, dropping 70% overnight as market makers look for more profitable markets on other exchanges and pairs.
Slippage
Slippage is another important measure to gauge liquidity in markets, placing a percentage loss on an order due to lack of liquidity. For a $100k sell order in BTC markets, the most liquid USD pair and the most liquid USDT pair had similar slippage of 0.1% to start March.
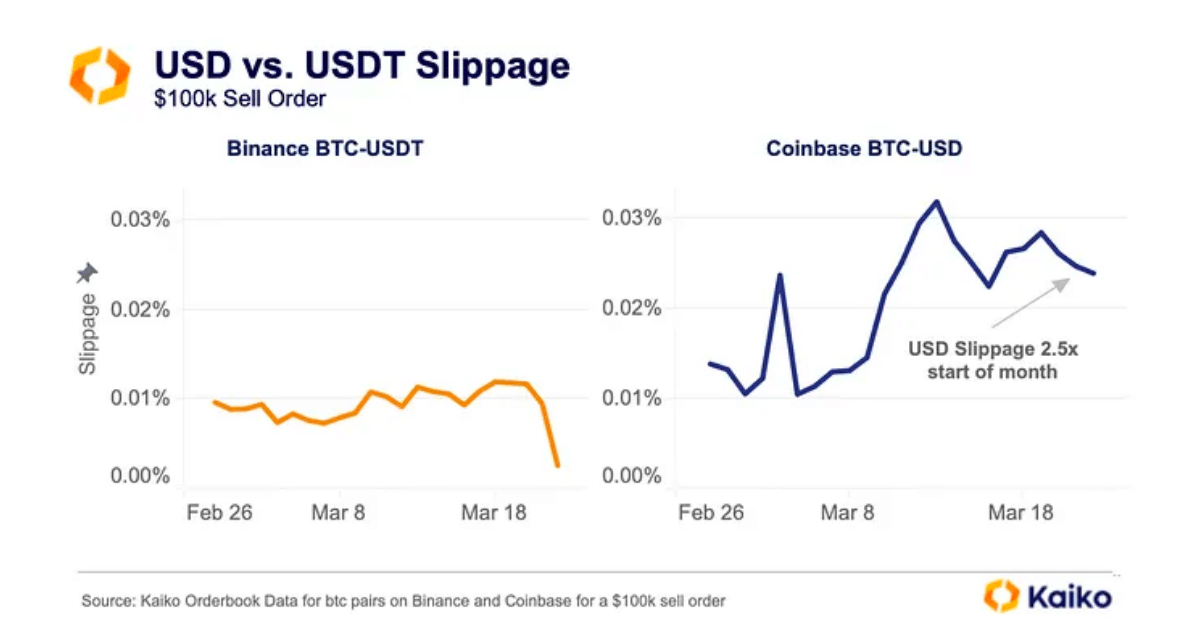
However, the fears over USD payment rails gripped liquidity markets in the U.S and we can see the spike in slippage around March 13th on Coinbase, compared to only a slight increase on the USDT pair on Binance. Slippage for the BTC-USD pair on Coinbase remains 2.5x higher than it was at the start of the month as USD liquidity suffers across the board in crypto markets.
Volumes
No liquidity analysis would be complete without taking a look at volumes and examining the different market dynamics that are occurring in crypto today. Taking a step back to give some context with regards to volumes, the good news is that volumes have significantly picked up from the multi year lows that were set at the end of 2022.
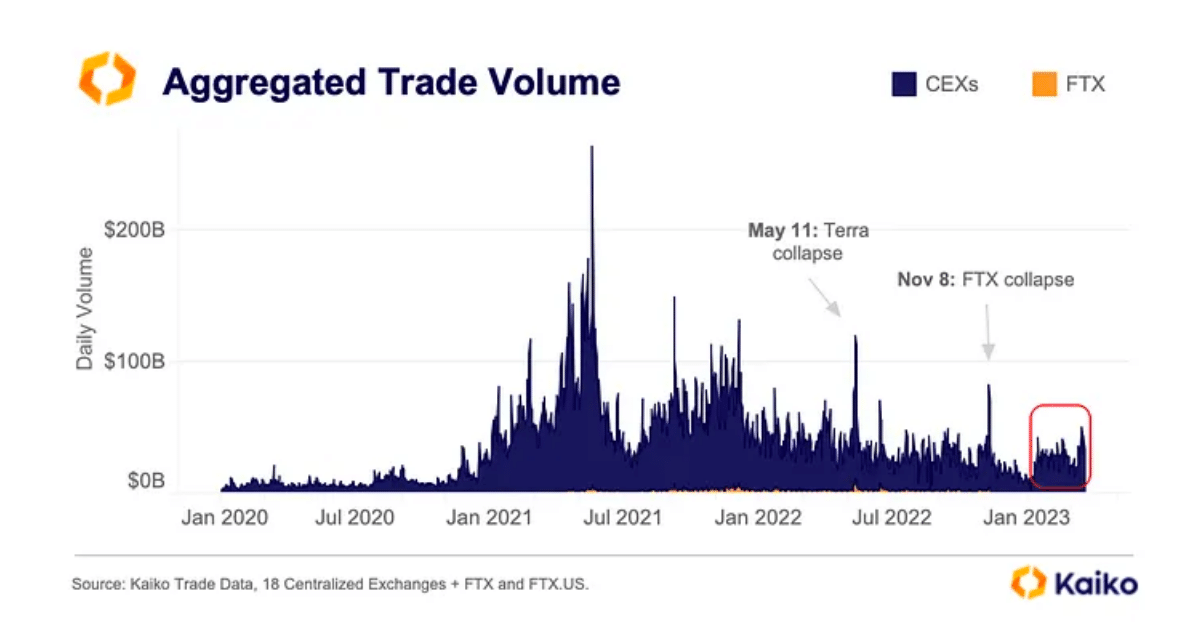
Looking at previous volume patterns, we seem to be at a similar level to both the start of 2022 and 2021, both resulting in very different outcomes. Which direction we move is anyone’s guess, but in order to have a sustained move upwards we certainly need a pick up in volumes, which we’ve started off with, and a pick up in liquidity, which as we’ve seen has yet to happen.
Breaking volumes down per exchange, it’s a story of Binance vs everyone else. Notably, Coinbase has failed to gain any market share in volumes despite the worries surrounding USD pairs, and the launch of its own Layer 2, Base.
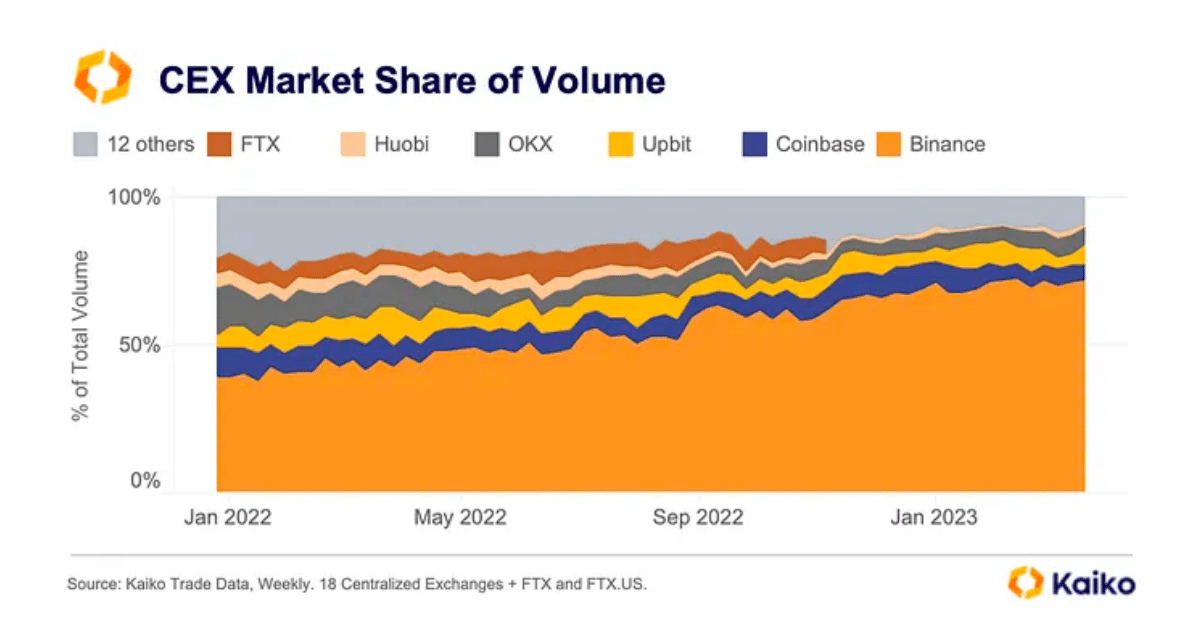
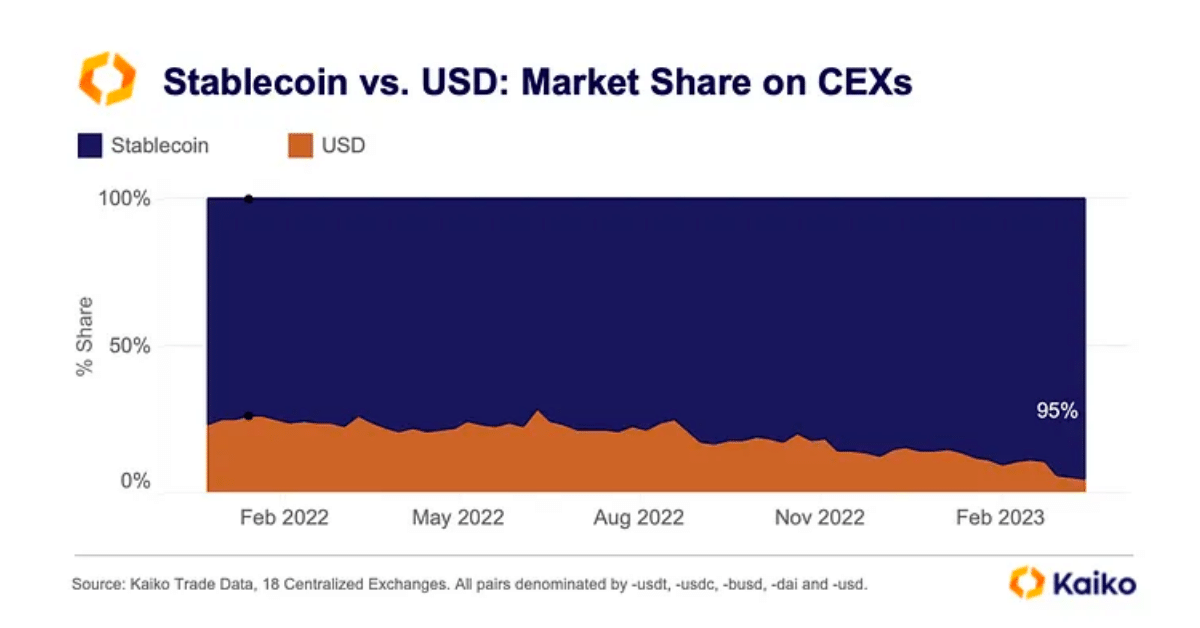
One conclusion from the volume share per exchange is that very little volume actually flows into U.S exchanges and in turn, USD pairs. The split of stablecoin vs. USD volumes reinforces this conclusion, with stablecoins rising from a 77% share of volumes to 95% in just over a year.
Conclusion
The reality is USD pairs are being phased out by investors, in favor of stablecoins, and have been for some time. This makes the lack of USD payment rails more of an institutional problem than an investor issue, but the knock-on effects of reduced liquidity which we have seen in depth, spreads and slippage will have an impact on everyone in the space.
I have faith that someone in the U.S will be able to offer a payment network similar to SEN or Signet, the gap in the market is simply too big not to fill. Once, and only once that happens, will we see a boost to liquidity as market makers feel more comfortable offering liquidity in the space. A boost in liquidity will mean less volatility and a more attractive asset class for the next wave of investors to kick off the next bull cycle.
Kaiko is the leading source of cryptocurrency market data, providing businesses with industrial grade and regulatory compliant data. We empower market participants with global connectivity to real time and historical data feeds across the world’s leading crypto exchanges.
Share this article
Comments
Most Recent
Find The Right Partners for
Your Trading Business
Sign up and join over 5,000 professional members who receive personalized news alerts, curated professional connections, and more for free!

Dark pool trading was once the preserve of institutional desks, but a new wave of AI tools is promising self-directed investors a look into non-displayed liquidity and where the big money sits. This article explains what dark pools actually are, why retail traders face an even bigger information gap in FX than in equities, and what AI-driven intelligence platforms like IUX24 can and cannot reveal about institutional positioning.

As tokenisation and digital assets move from niche curiosity to mainstream expectation, banks and financial institutions face an uncomfortable truth: their legacy core banking systems were never built for this. From order execution and pre-funding to custody, portfolio management and gas fees, Olaf Ransome explores the key infrastructure challenges FIs must navigate and asks whether to re-use, buy or build their way to a solution that actually scales.

LSEG's DiSH promises atomic settlement and 24/7 PvP and DvP capability using tokenised commercial bank deposits. But when the balances move and the banks don't, who actually owns what? Olaf Ransome examines the mechanics - and the risks.
LiquidityFinder's Sam Low sits down with Nathan Sage, founder and CEO of Sage Capital Management, to trace his journey from FX fund manager to running a Bitcoin fund doing $1BN a day in 2016 — and how that experience of pain built one of the most connected prime brokerages in the digital assets market today.

Klarna is partnering with Coinbase, raising stablecoin-denominated funding and launching KlarnaUSD. We break down the treasury logic, merchant incentives and agentic AI payments angle — and what other CFOs should take from it.

Olaf Ransome’s latest article on liquidity management explores PORTS (Perpetual Overnight Rate Treasury Securities) and how they could expand the supply of on-chain high-quality liquid assets (HQLA) for treasury and cash management. He explains why long cash balances create risk, how stablecoins and tokenised money market funds need safe short-duration assets, and what PORTS could mean for reverse repo, liquidity management and wholesale banking.

Discover whether KuCoin is still “The People’s Exchange” in 2026. This in-depth KuCoin review breaks down fees, KYC, security, Proof of Reserves, supported coins, deposits/withdrawals, futures, margin, Earn and the platform’s standout free trading bots — plus who it’s best for (and who should avoid it).

African FX liquidity is shaped by hard-currency scarcity and capital controls. Roland Schilling, COO at Sika Financial, explains how interbank reference rates differ from parallel markets, and how Sika settles via CCP/PvP.
Create Your FREE Account
Get access to latest news, updates, real-time data, brokerage and trading firm insights and customized information feeds.

The Award represents the latest milestone in PLUGIT's strategic evolution toward becoming a leading Brokerage Technology Provider, delivering one connected trading technology solution for modern brokerages.

Looking for a NAS100 price action forecast? See how the Head and Shoulders pattern triggered a massive drop and why our bearish setup won.

Discover how tracking active drilling rigs acts as a vital energy sector indicator for future oil supply.

Want to master consistent trading? Discover why your daily routine matters more than a new strategy to improve your trading psychology.

Discover why these weekly reports drive global energy demand, inflation, and market volatility.

Read our latest NAS100 price action forecast to see if a massive Head and Shoulders pattern will trigger a major bearish trend and sell-off.

Want to find the best reversal chart patterns before they happen? Learn how to identify bullish and bearish reversal patterns and confirm trades.

The YOONIT Broker Technology Solution by PLUGIT.

Brokers replacing fragmented tools with connected ecosystems are gaining real competitive advantage. Discover how YOONIT makes it possible.

Explore how YOONIT Copy Trade solution gives brokers the visibility and control to run revenue driven copy trading activities.
Feed